Part 1: Explore the GitOps UI
Weave GitOps provides insights into your application deployments, and makes continuous delivery with GitOps easier to adopt and scale across your teams. We will now login to the dashboard web UI and start to explore the state of our GitOps deployments.
Login to the GitOps Dashboard
Expose the service running on the cluster
kubectl port-forward svc/ww-gitops-weave-gitops -n flux-system 9001:9001Open the dashboard and login using either the emergency cluster user or OIDC based on your configuration. If you followed the example above, the emergency user will be configured with the username set to
admin. The password to the non-encrypted value you provided as$PASSWORD.
Applications view
When you login to the dashboard you are brought to the Applications view, which allows you to quickly understand the state of your deployments across a cluster at a glance. It shows summary information from kustomization and helmrelease objects.
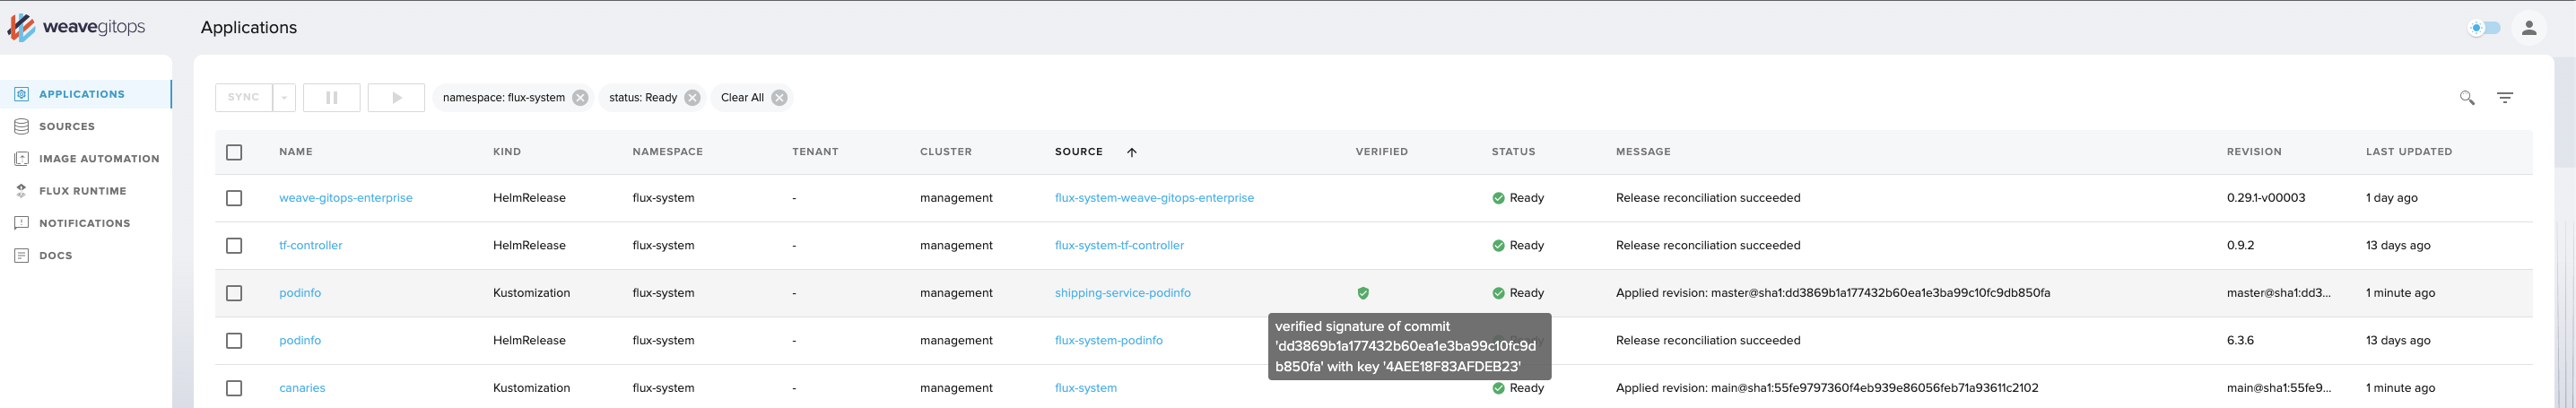
In the above screenshot you can see:
- a
Kustomizationcalledflux-system, which was created when Flux was bootstrapped onto the Cluster, and is deploying the GitOps Toolkit controllers. It is also deploying further Flux objects defined in the same repo, so that Flux will deploy additional workloads which includes our Helm Chart for Weave GitOps. - a
HelmReleasecalledww-gitopswhich deploys the aforementioned Helm Chart.
This table view shows the reported status so you can understand whether a reconciliation has been successful, and when they have last been updated. You can also see where the Flux objects are deployed and which Source object they are reconciling from; clicking the name of the Source it will take you to a detail view for the given source object. The view automatically updates every few seconds so you know the current state of your system.
You can search for and filter objects by Name by clicking the magnifying glass, or filter by Type by clicking the strawberry icon to its right.
Clicking the Name of an object will take you to a detailed view for the given Kustomization or HelmRelease. Which we will explore in a moment.
The Sources view
Clicking on Sources in the left hand menu will bring you to the Sources view. This view shows you where flux pulls its application definitions from, for example Git repositories, and the current state of that synchronization. This shows summary information from gitrepository, helmrepository, helmchart and bucket objects.
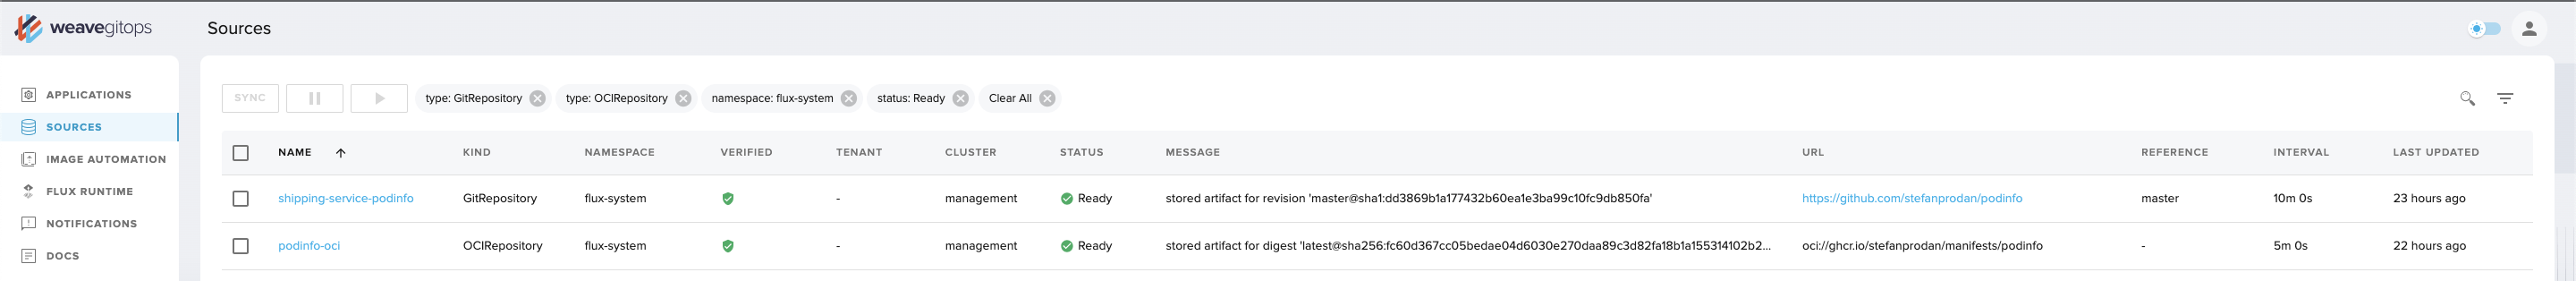
In the above screenshot you can see:
- a
GitRepositorycalledflux-system, which was created when Flux was bootstrapped onto the Cluster, and contains the manifests for the GitOps Toolkit and Weave GitOps and various Flux objects. - a
HelmChartcalledflux-system-ww-gitops, which is automatically created by Flux when you define aHelmReleaseto deploy a Helm Chart from a given source. - a
HelmRepositorycalledww-gitopswhich pulls from the Helm Repository where the Weave GitOps Helm Chart is published.
The table view again shows summary status information so you can see whether Flux has been able to successfully pull from a given source and which specific commit was last detected. It shows key information like the Interval, namely how frequently Flux will check for updates in a given source location. You can apply filtering as per the Applications view, can click the URL to navigate to a given source i.e. a repository in GitHub, or the Name of a Source to view more details about it.
The Flux Runtime view
Clicking on Flux Runtime provides information on the GitOps engine, which is continuously reconciling your desired and live state. It provides two different tabs: controllers and CRDs.
Controllers
The controllers tab shows your installed GitOps Toolkit Controllers and their version.
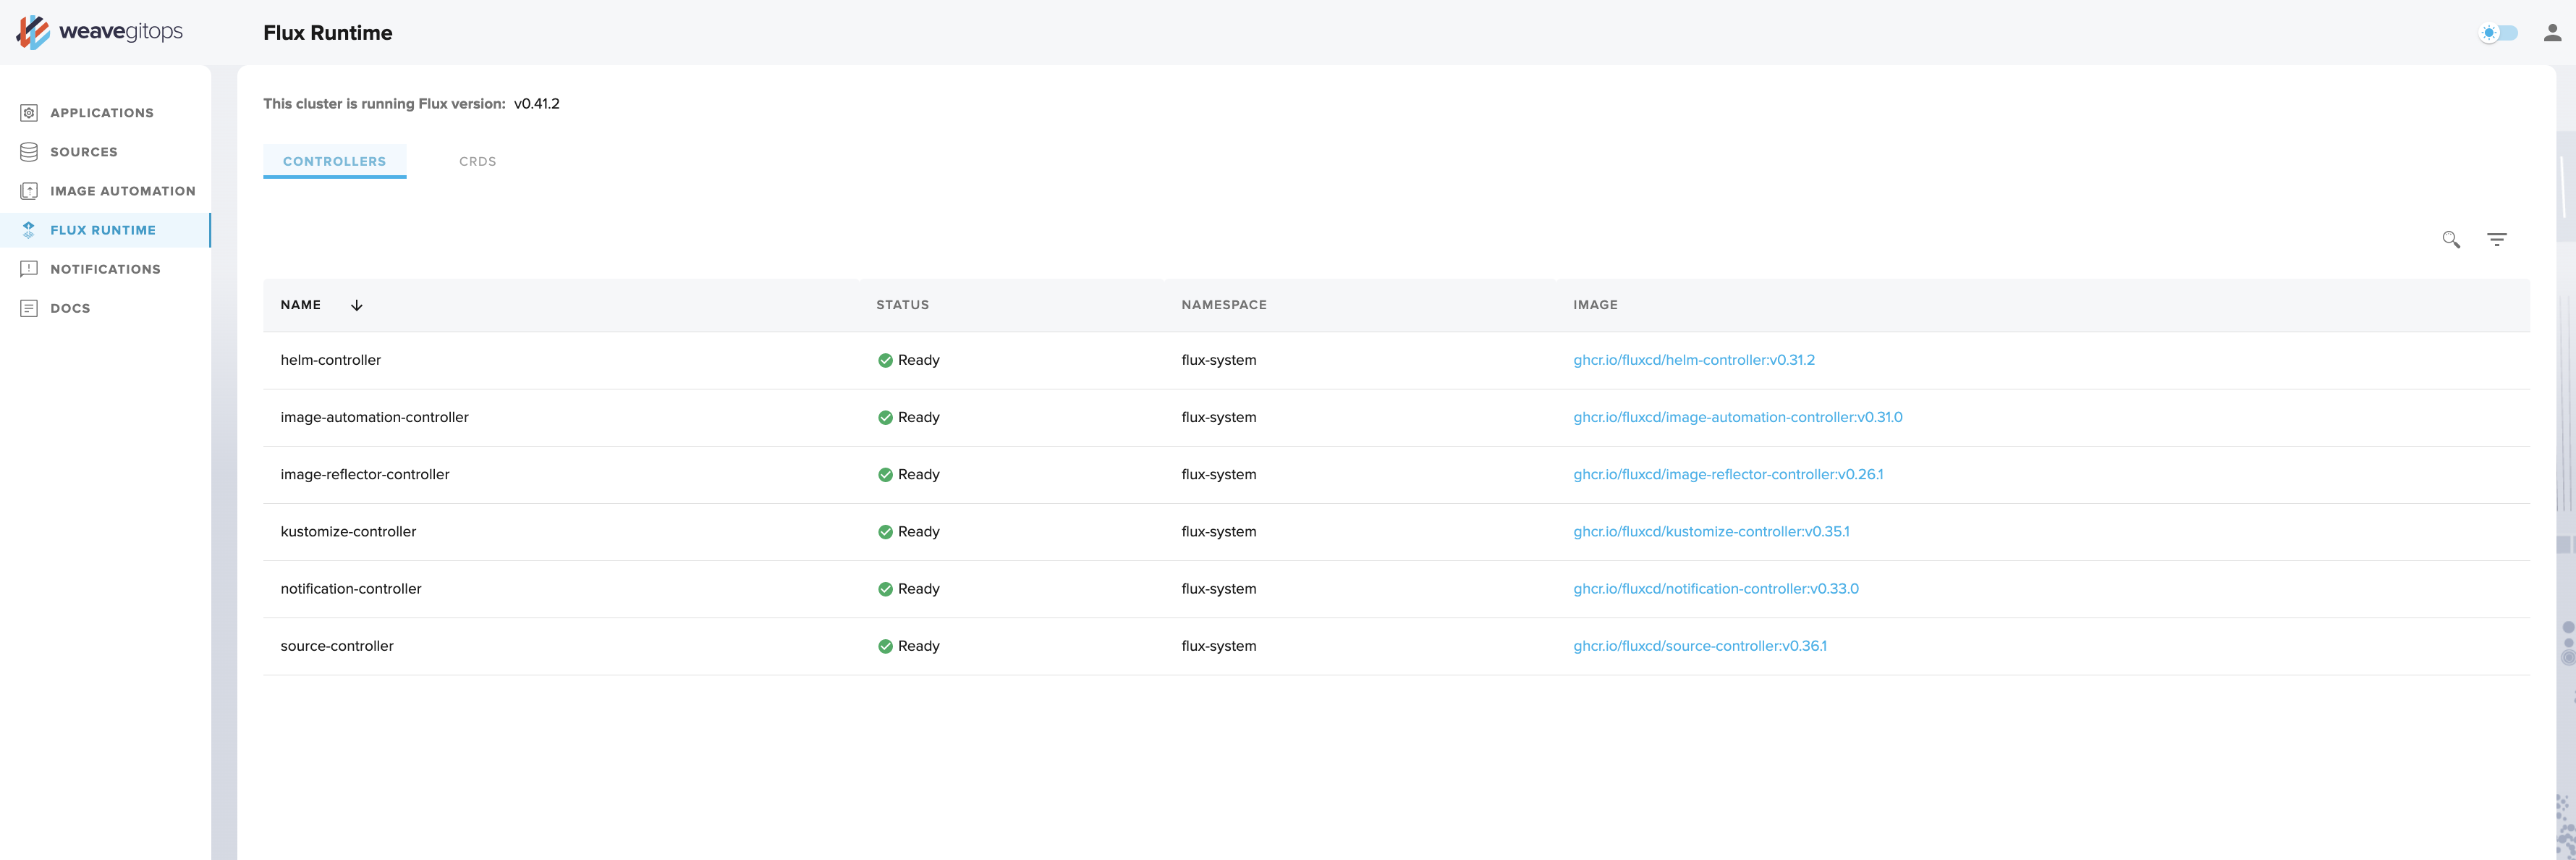
By default flux bootstrap will install the following controllers:
- helm-controller
- kustomize-controller
- notification-controller
- source-controller
For a full description of the controllers, see GitOps ToolKit components in the Flux documentation.
From this view you can see whether the controllers are healthy and which version of a given component is currently deployed.
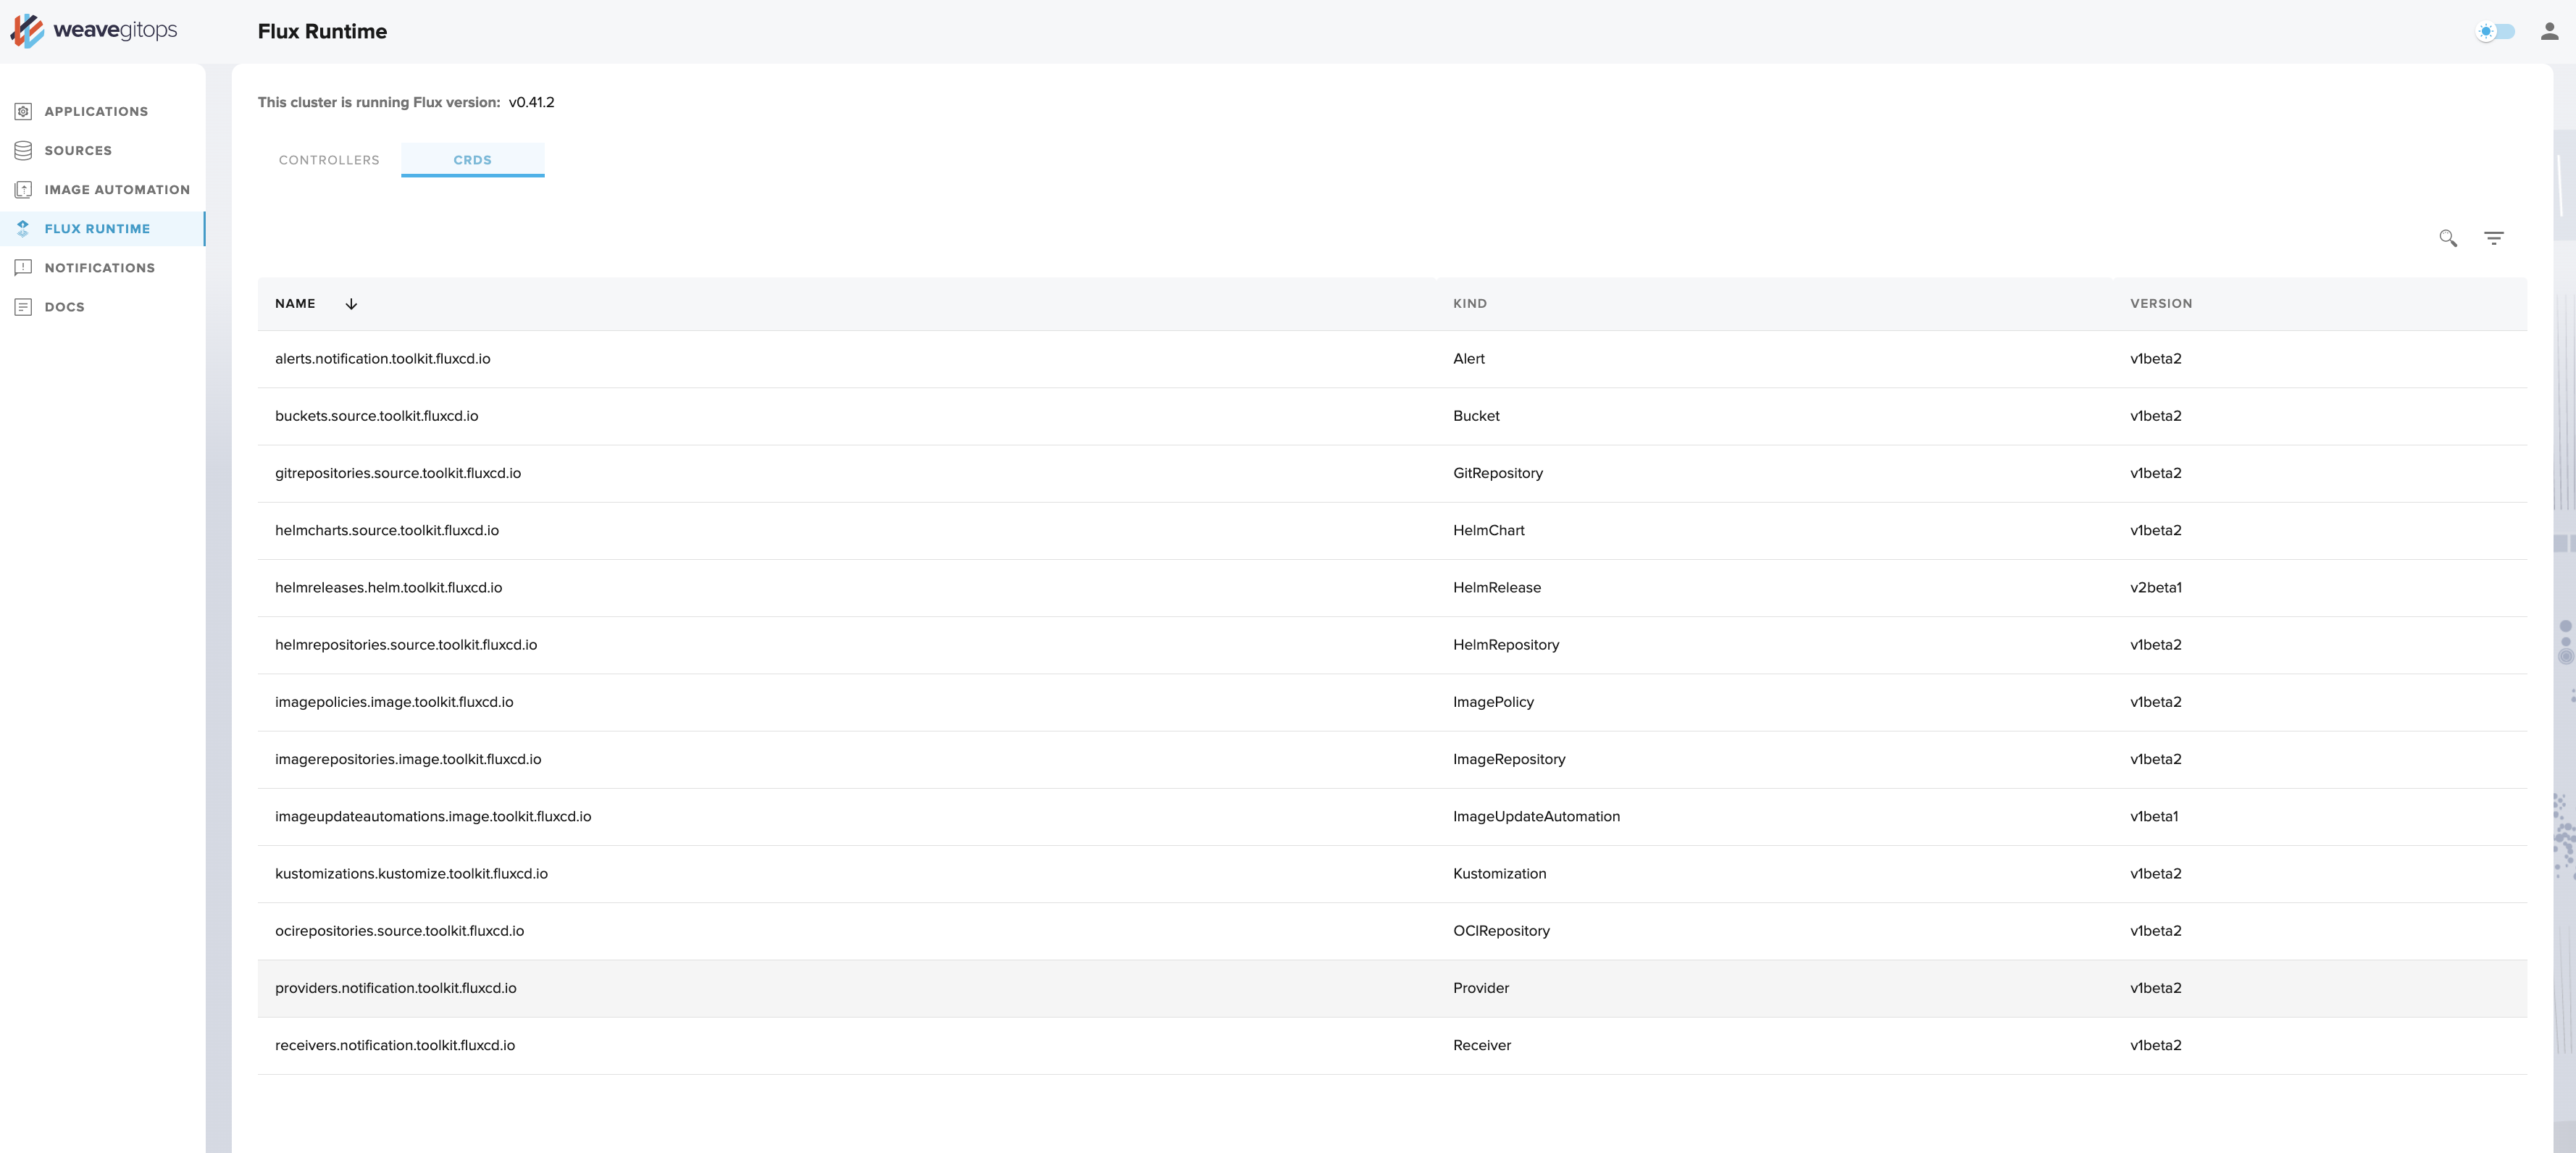
CRDs
The CRD tab lists the custom resources that the GitOps Toolkit Controllers use. This helps you see what resources you will be able to create.
Exploring the flux-system deployment
Let's explore the flux-system kustomization. Navigate back to the Applications view and click on the flux-system object.
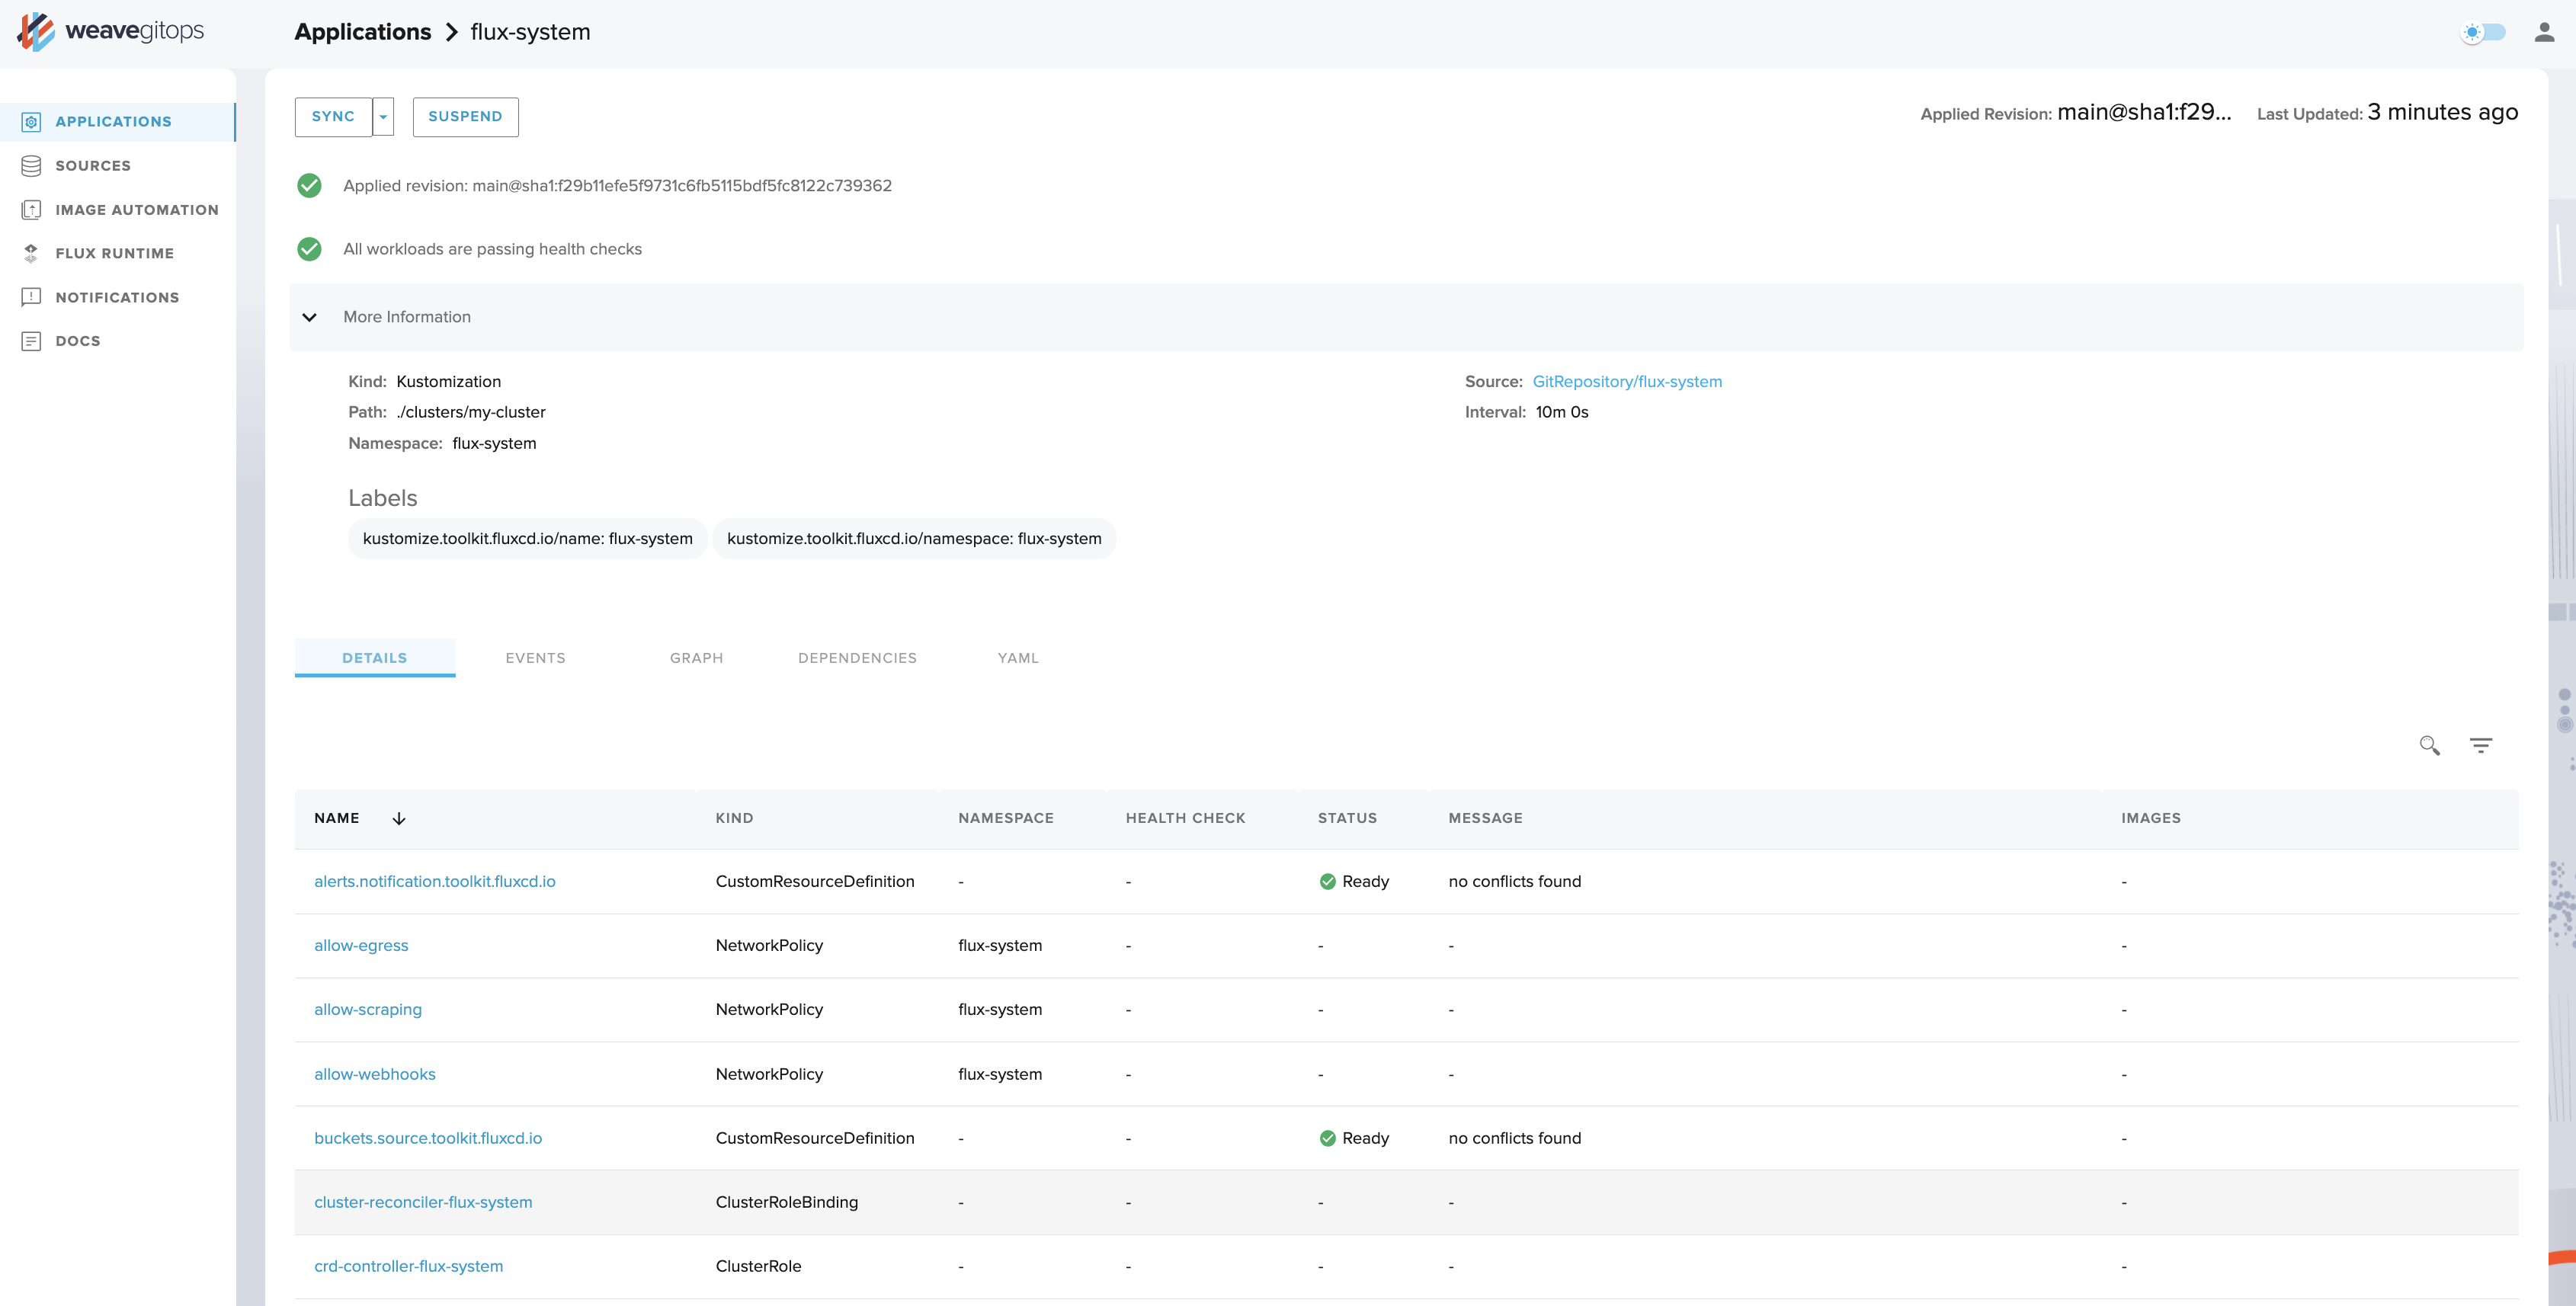
After a few moments loading the data, you should see similar to the above screenshot. From here you can see key information about how this resource is defined: which Source it is reading from, the latest applied commit, the exact path with the Source repository that is being deployed, and the Interval in which Flux will look to reconcile any difference between the declared and live state - i.e. if a kubectl patch had been applied on the cluster, it would effectively be reverted. If a longer error message was being reported by this object, you would be able to see it in its entirety on this page.
Underneath the summary information are four tabs:
- Details (default) is a table view which shows all the Kubernetes objects (including flux objects, deployments, pods, services, etc) managed and deployed through this
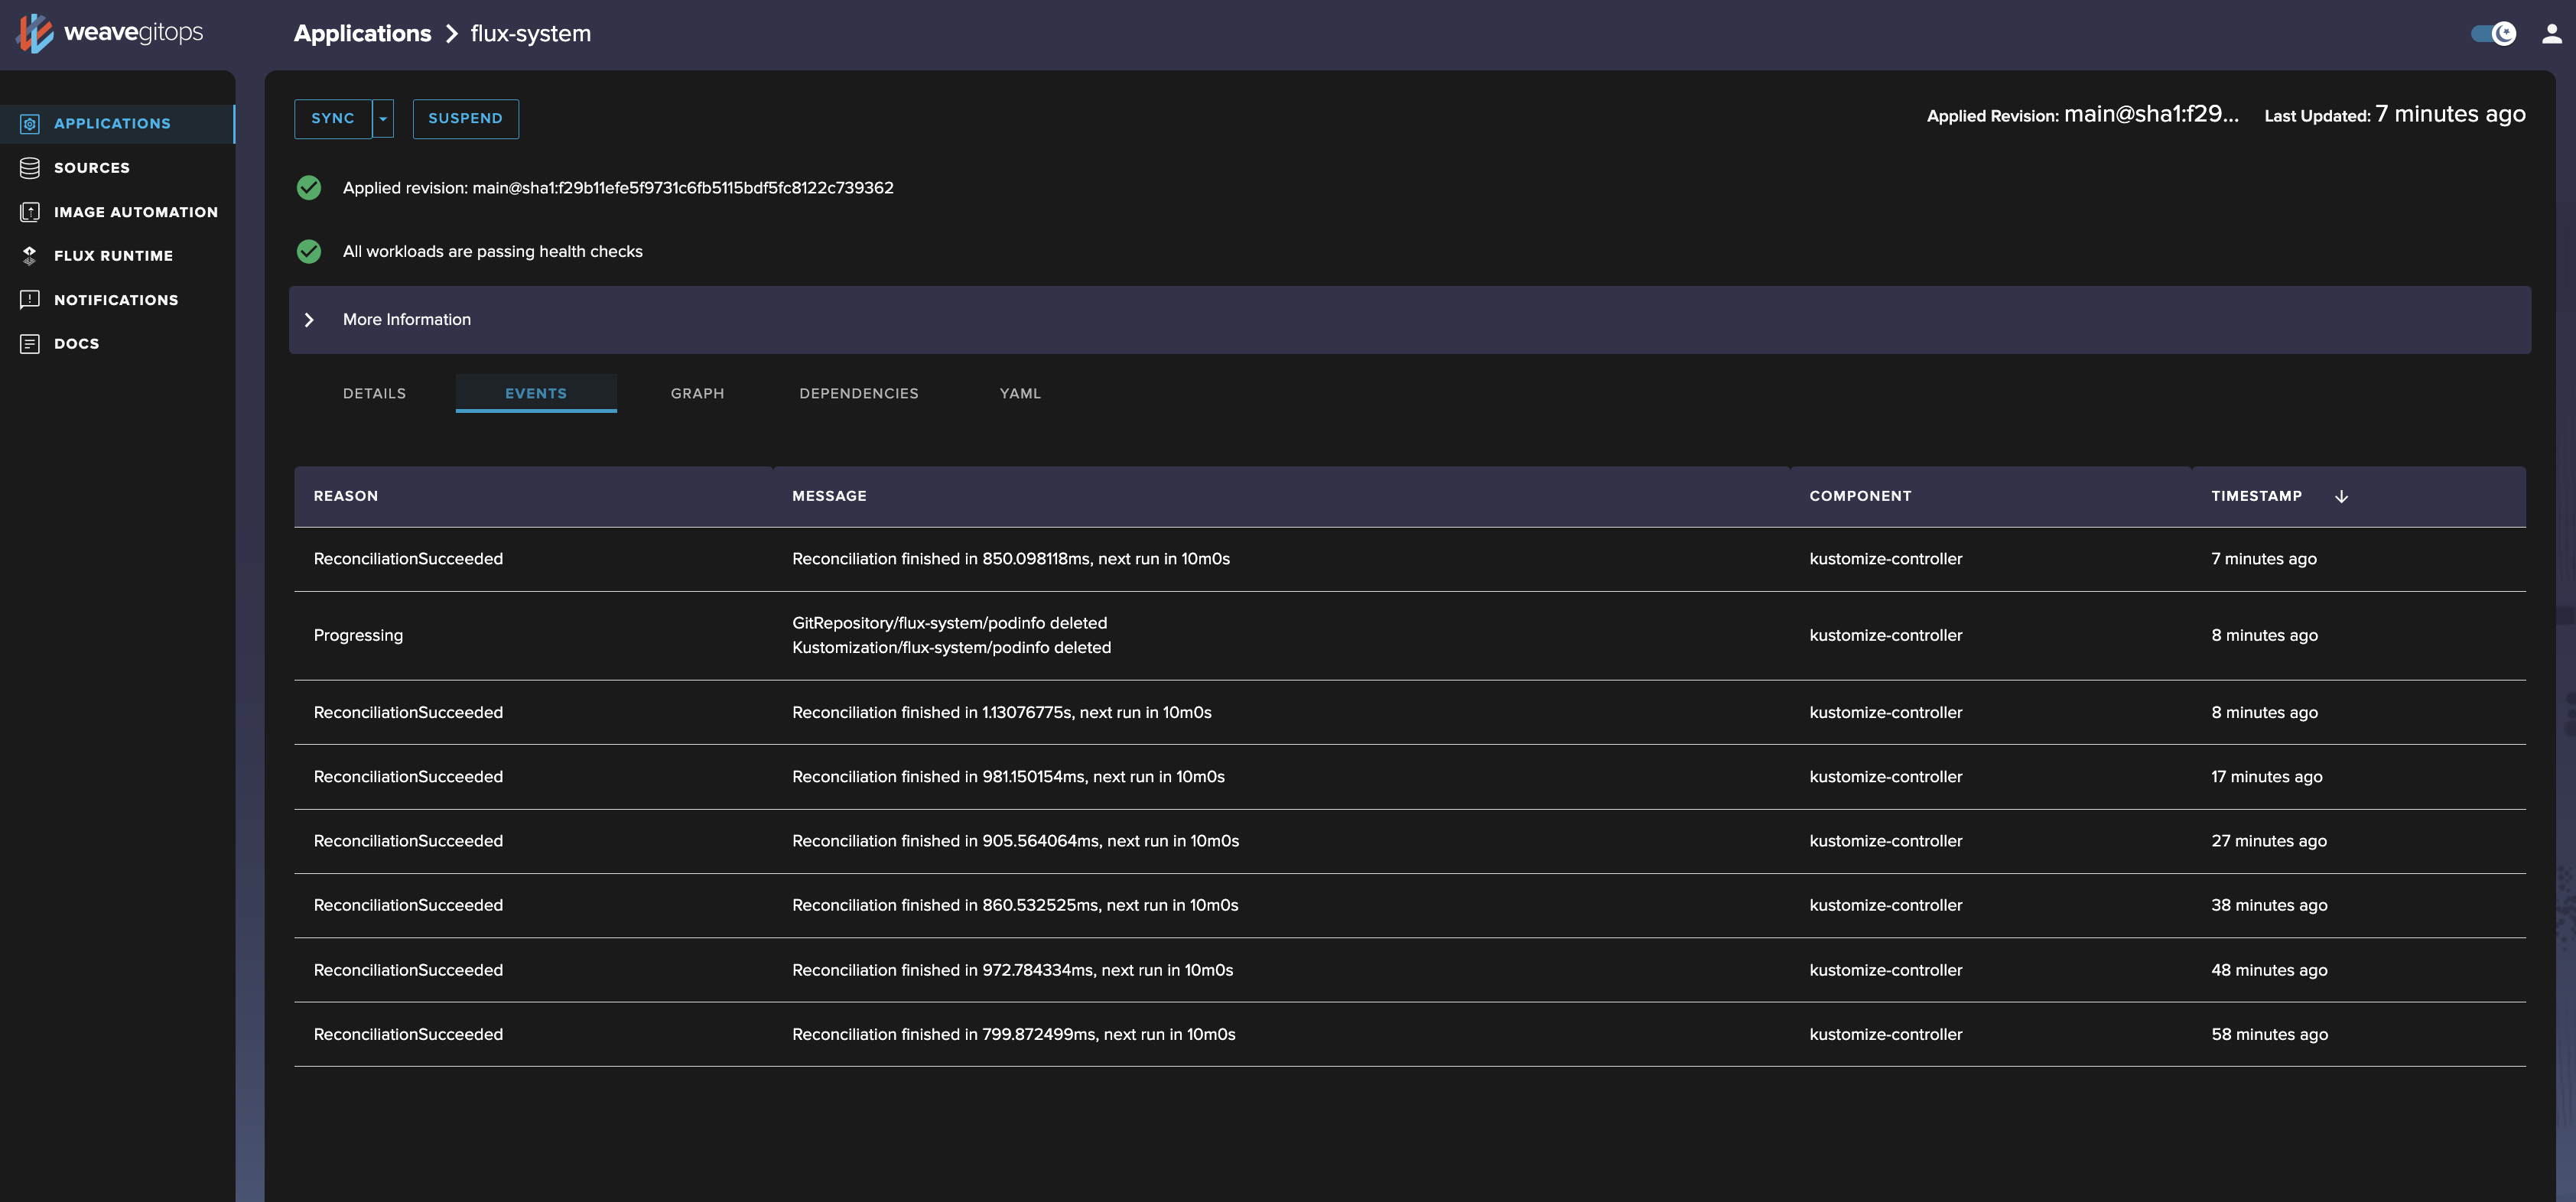
kustomization. - Events (shown below) shows any related Kubernetes events to help you diagnose issues and understand health over time.
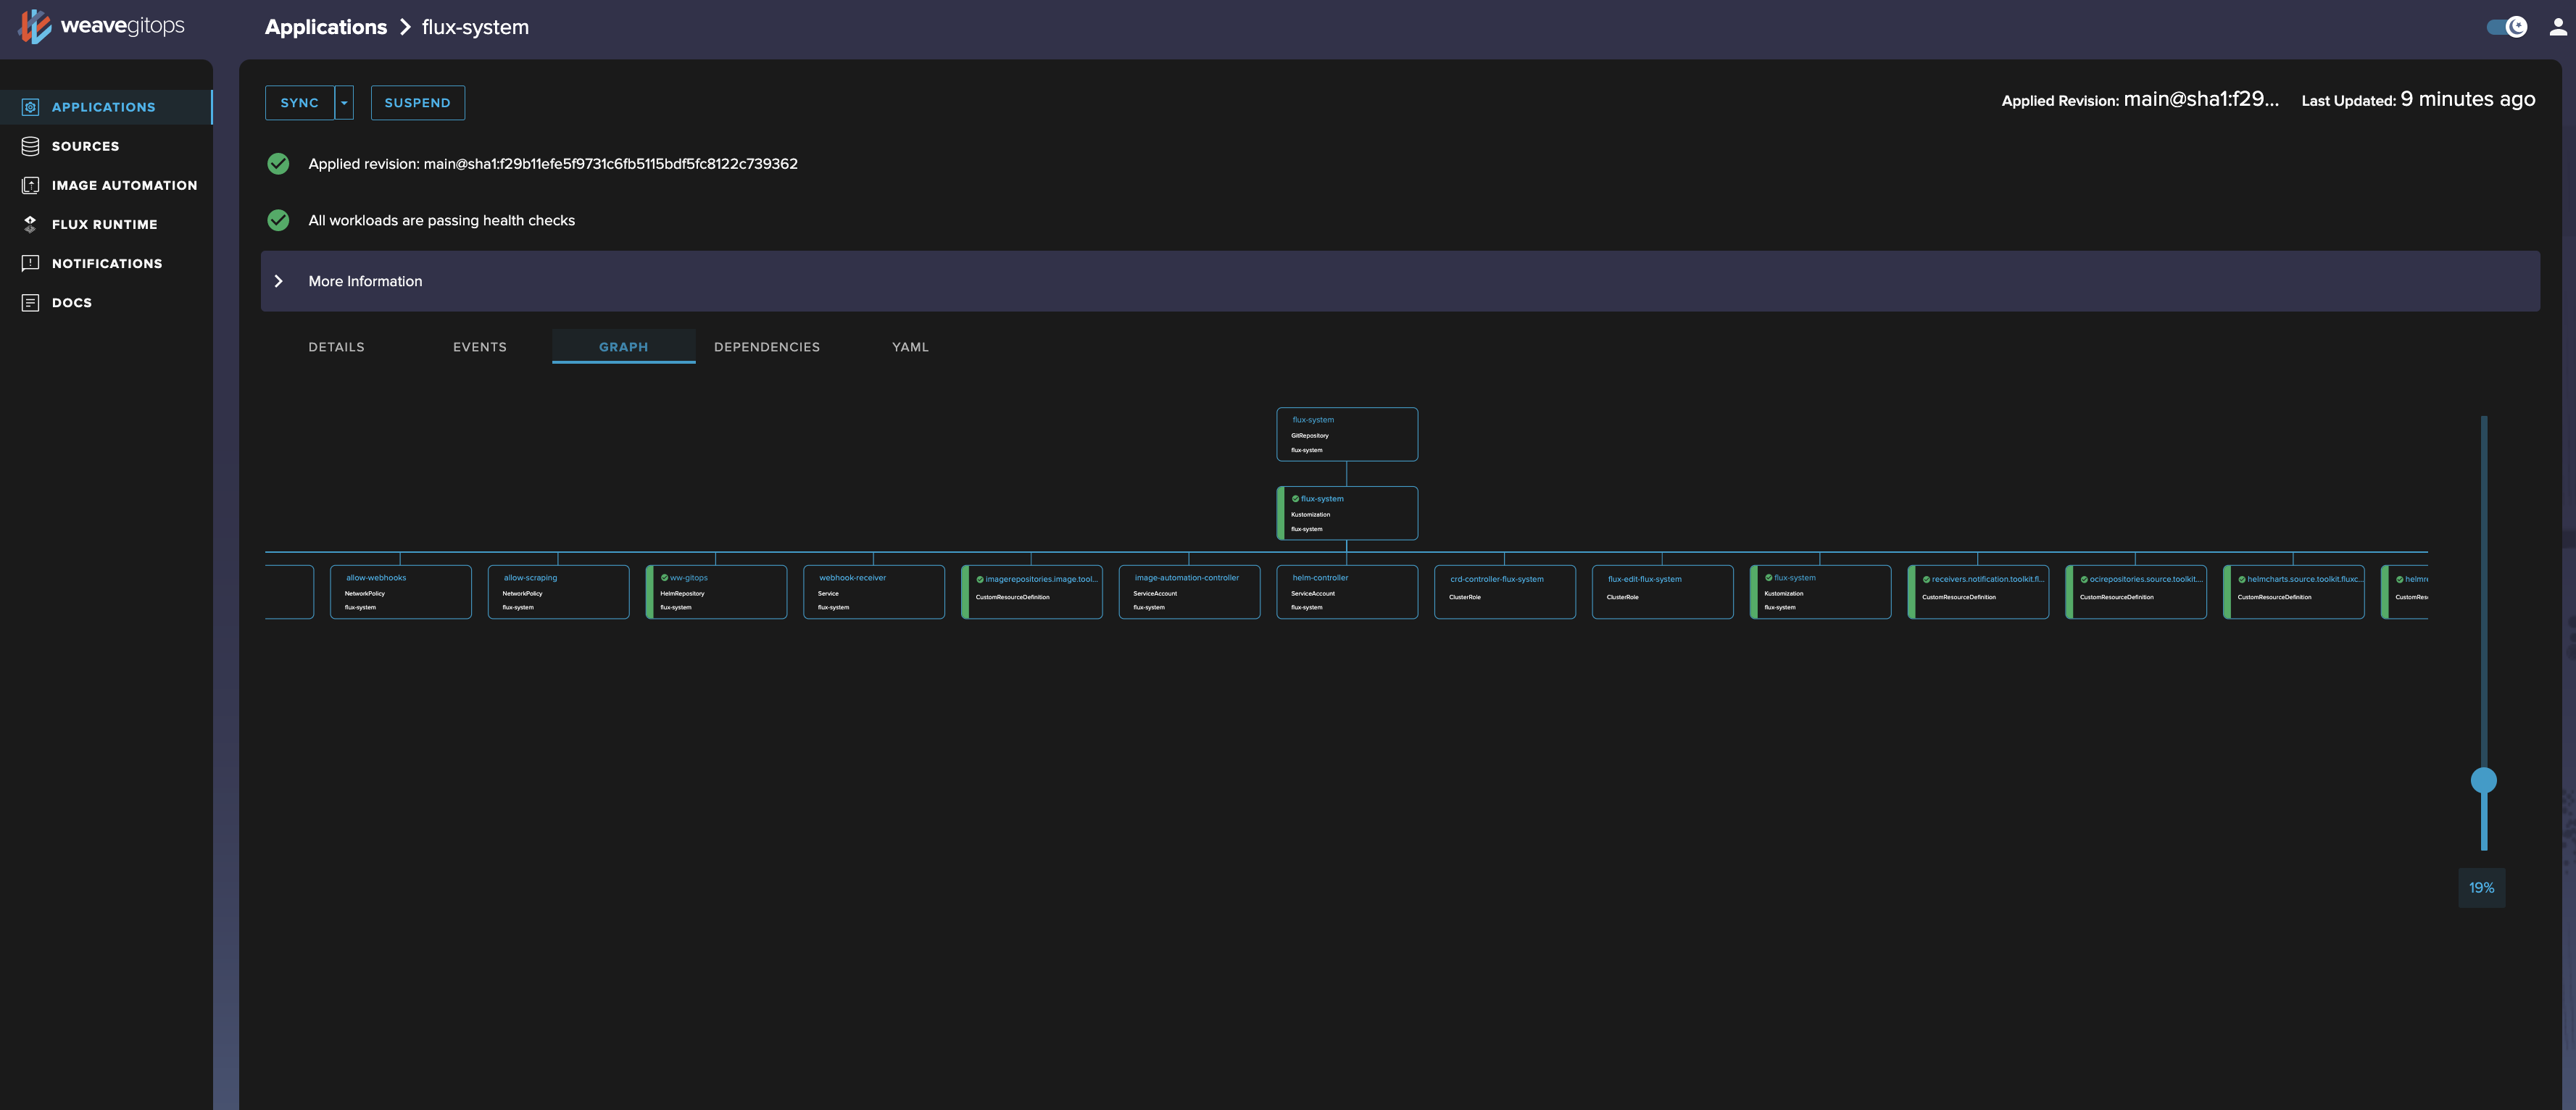
- Reconciliation Graph (shown below) provides a directional graph alternative to the Details view to help you understand how the various objects relate to each other.
- Dependencies provides a directional graph that helps you understand dependencies between objects, if there are any. This helps you make sure that your automations are set up in the correct order.
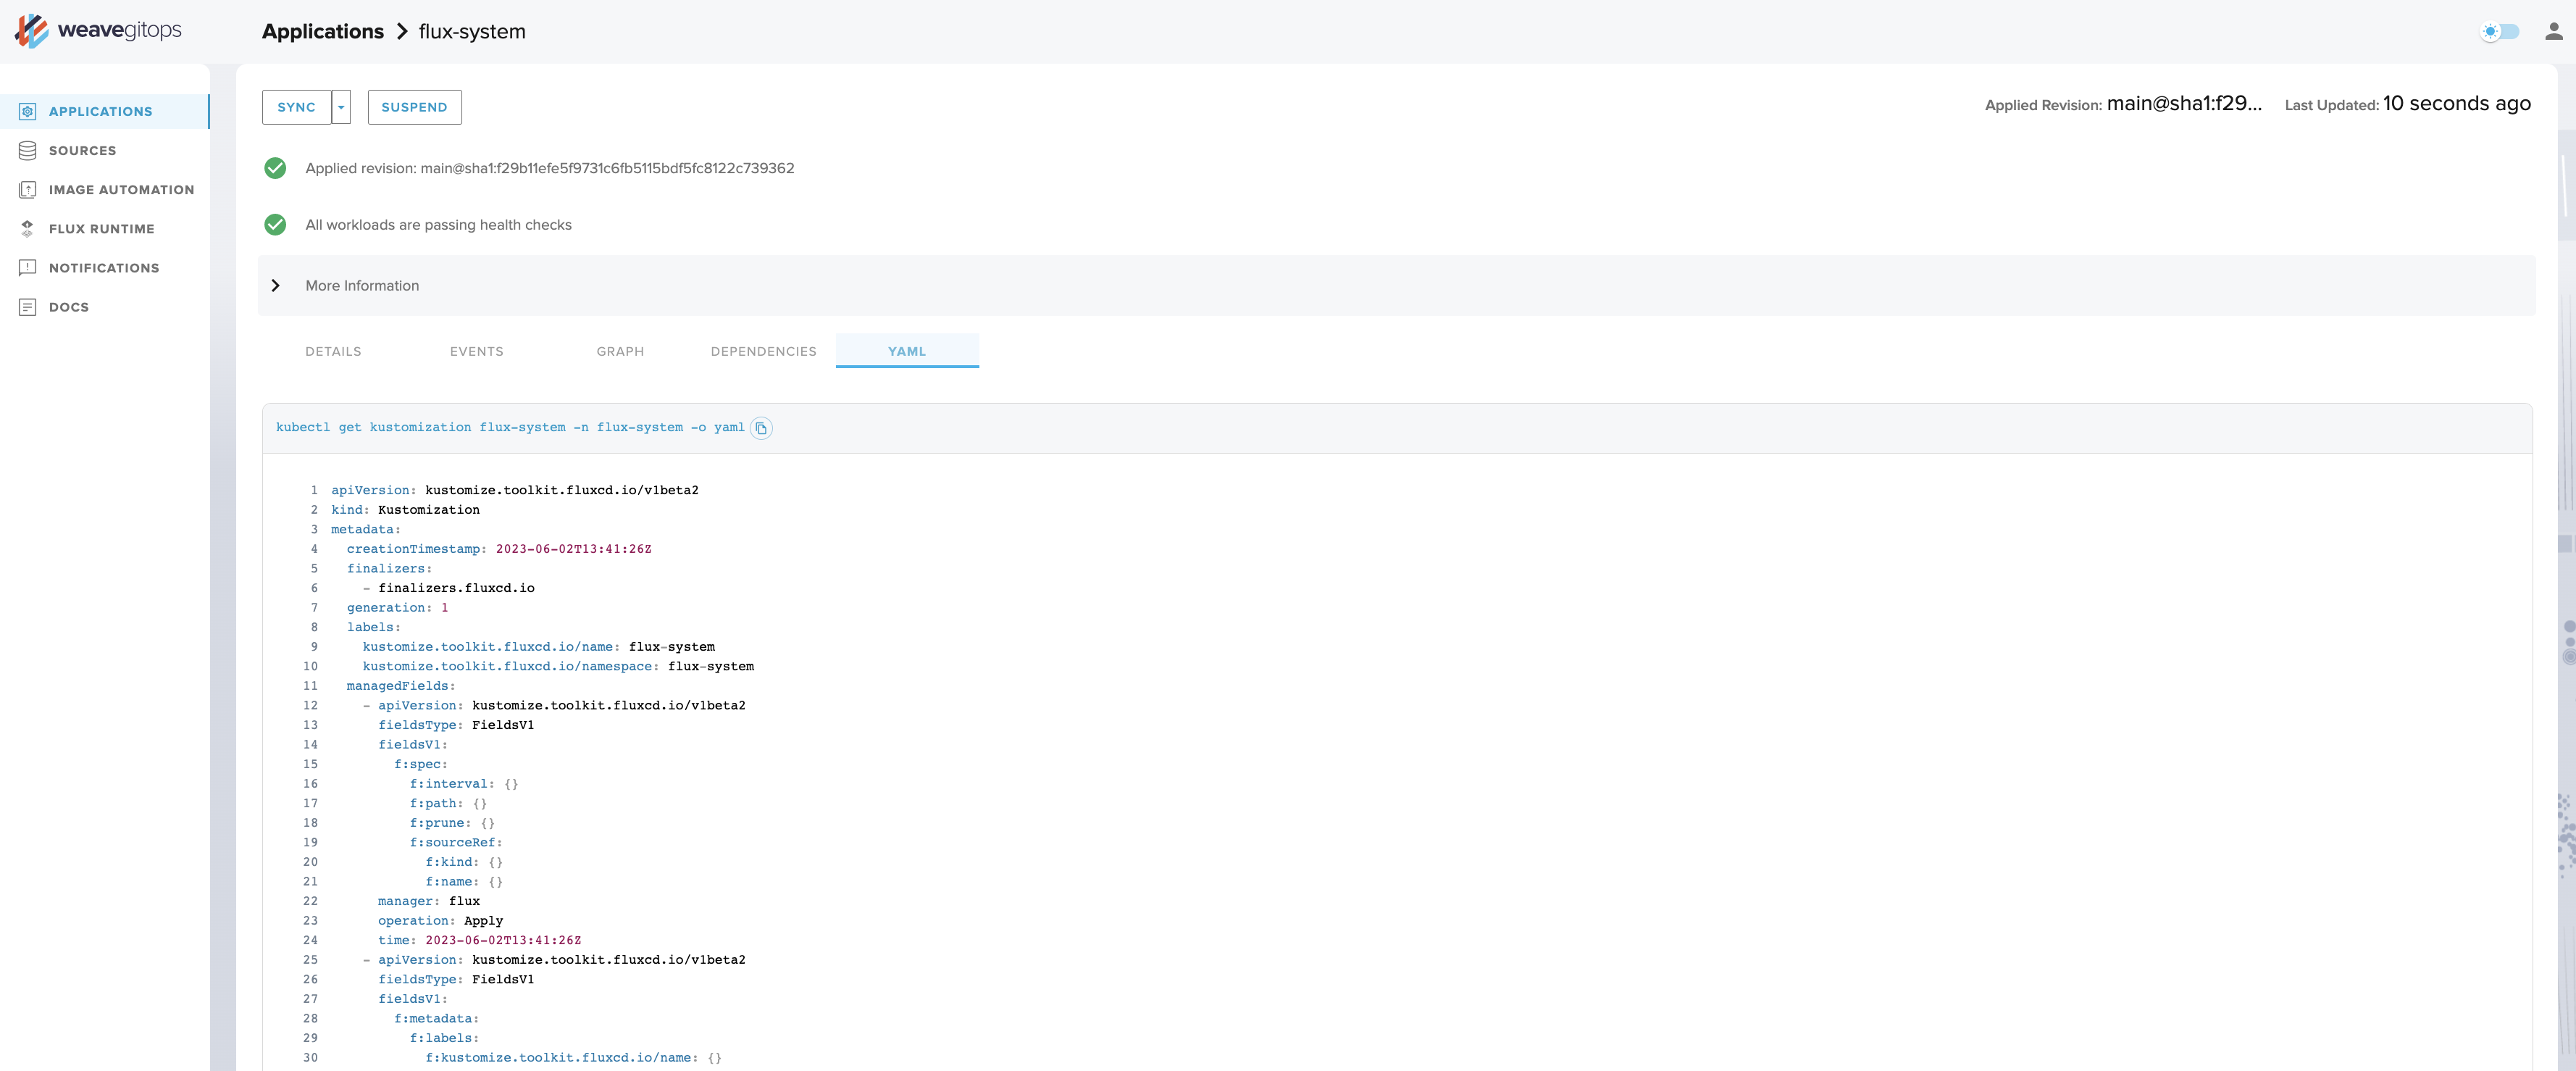
- Yaml (shown below) provides a raw dump on the current object as it currently exists inside your cluster. Note that this will be different from what's in your gitops repository, since this yaml view will contain the current status of the object.
Events tab
Reconciliation Graph tab
Yaml tab
Source details view
Finally let's look at the Source in more detail - go back to the Details tab, and click GitRepository/flux-system from the summary at the top of the page.
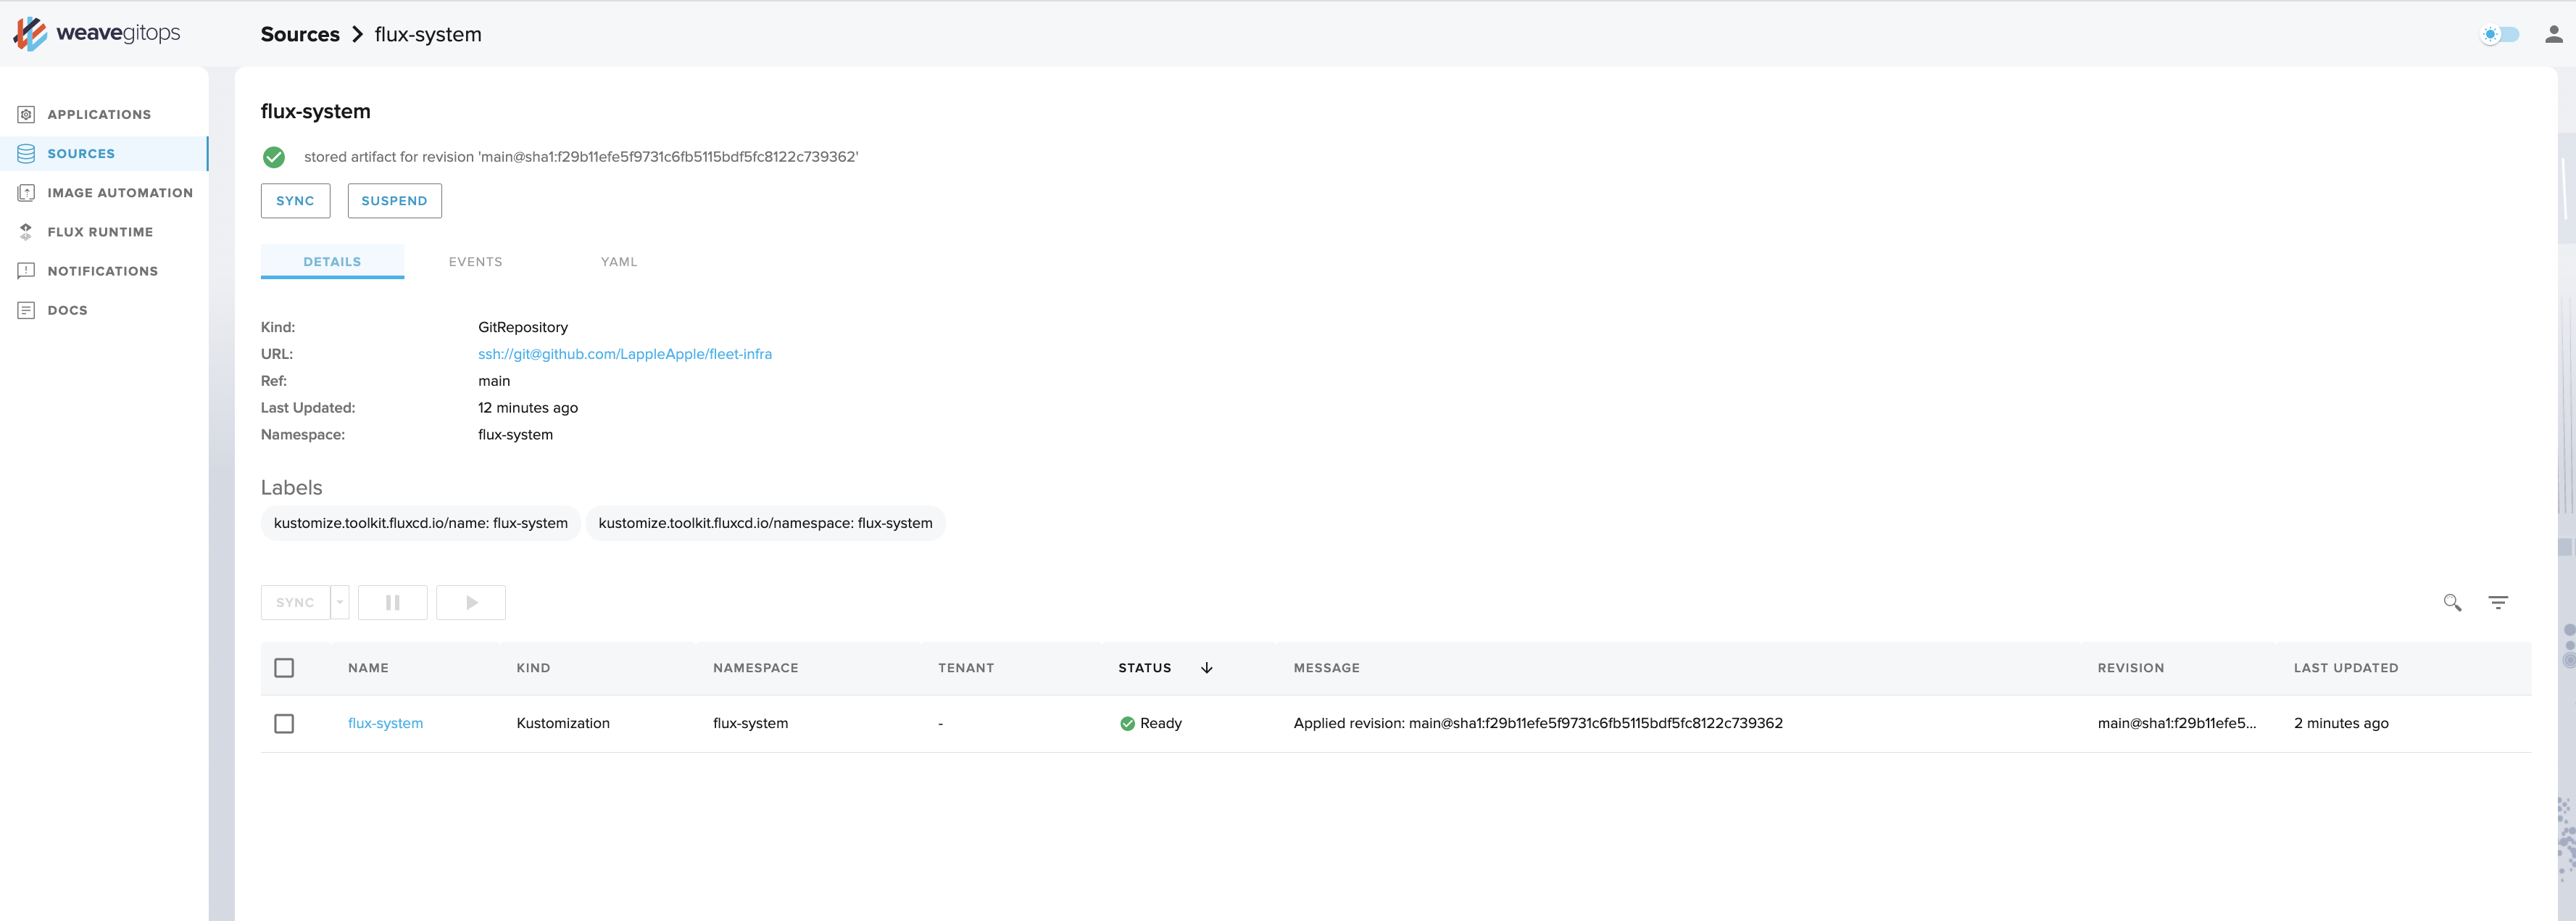
As with an Application detail view, you can see key information about how the resource is defined.
Now we are familiar with the Dashboard, let's deploy a new application ✨.