Operations Enterprise
This feature is in alpha and certain aspects will change
We're very excited for people to use this feature. However, please note that changes in the API, behaviour and security will evolve. The feature is suitable to use in controlled testing environments.
As platform engineer you could need to have a finer understanding on the underlying logic for Explorer. The following options are available to you to operate and troubleshoot it.
Debug Access Rules
It is a debugging tool to make visible explorer authorization logic. You could find it as tab Access Rules alongside
the Query tab.
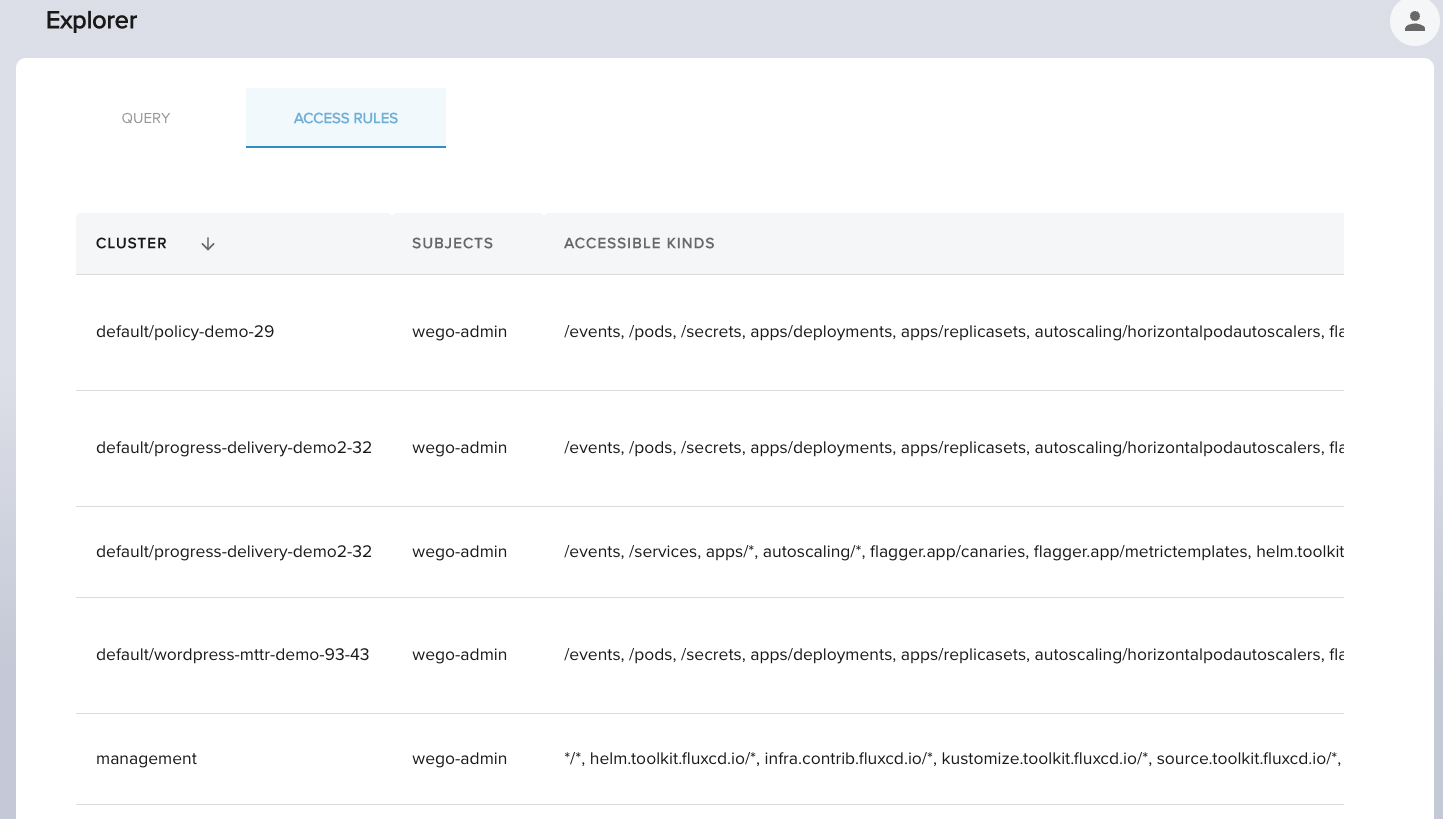
You could discover by Cluster and Subject the Kinds it is allowed to read. These are the rules that
will be the source of truth doing authorization when a user does a query.
Monitoring
Explorer provides the following telemetry to use for operations.
Metrics
Explorer exports Prometheus metrics. Configuration happens during releasing as shown below.
---
apiVersion: helm.toolkit.fluxcd.io/v2beta1
kind: HelmRelease
metadata:
  name: weave-gitops-enterprise
  namespace: flux-system
spec:
  values:
    #### Metrics - Prometheus metrics configuration
    metrics:
      # Enables metrics generation and prometheus endpoint
      enabled: true
      service:
        # -- Port to start the metrics exporter on
        port: 8080
        # -- Annotations to set on the service
        annotations:
          prometheus.io/scrape: "true"
          prometheus.io/path: "/metrics"
          prometheus.io/port: "{{ .Values.metrics.service.port }}"
Querying
Explorer querying path is composed of three components exporting metrics:
- API server
- Datastore Reads
- Indexer Reads
API Server
Based on go-http-metrics, the following metrics are generated.
Request Duration: histogram with the latency of the HTTP requests.
http_request_duration_seconds_bucket{handler="/v1/query",method="POST",le="0.05"} 0
http_request_duration_seconds_sum{handler="/v1/query",method="POST"} 10.088081923
http_request_duration_seconds_count{handler="/v1/query",method="POST"} 51
Response Size: histogram with the size of the HTTP responses in bytes
http_response_size_bytes_bucket{handler="/v1/query",method="POST",le="0.05"} 10
http_response_size_bytes_sum{handler="/v1/query",method="POST"} 120
http_response_size_bytes_count{handler="/v1/query",method="POST"} 10
Requests In Flight: gauge with the number of inflight requests being handled at the same time.
http_requests_inflight{handler="/v1/query"} 0
Datastore Reads
Request Latency: histogram with the latency of the datastore read requests.
actionis the datastore read operation that could be eitherGetObjects,GetAccessRules,GetObjectByID,GetRolesorGetRoleBindings.statusis the result of the operation. It could be either read operation that could be eithersuccessorerror.
datastore_latency_seconds_bucket{action="GetObjectByID", le="+Inf", status="success"} 1175
datastore_latency_seconds_bucket{action="GetObjectByID", le="0.01", status="success"} 1174
datastore_latency_seconds_count{action="GetObjectByID",  status="success"} 1175
datastore_latency_seconds_count{action="GetRoleBindings",  status="success"} 47
datastore_latency_seconds_count{action="GetRoles",  status="success"} 47
datastore_latency_seconds_sum{action="GetObjectByID",  status="success"} 0.6924557999999995
datastore_latency_seconds_sum{action="GetRoleBindings",  status="success"} 1.329158916
datastore_latency_seconds_sum{action="GetRoles",  status="success"} 3.942473879999999
Requests In Flight: gauge with the number of inflight requests being handled at the same time.
actionis the datastore read operation that could be eitherGetObjects,GetAccessRules,GetObjectByID,GetRolesorGetRoleBindings
datastore_inflight_requests{action="GetObjectByID"} 0
datastore_inflight_requests{action="GetRoleBindings"} 0
datastore_inflight_requests{action="GetRoles"} 0
Indexer Reads
Request Latency: histogram with the latency of the indexer read requests.
actionis the index read operation that could be eitherListFacetsorSearchstatusis the result of the operation. It could be either read operation that could be eithersuccessorerror
indexer_latency_seconds_bucket{action="ListFacets", le="+Inf", status="success"} 1
indexer_latency_seconds_bucket{action="Search", le="+Inf", status="success"} 47
indexer_latency_seconds_sum{action="ListFacets", status="success"} 0.008928666
indexer_latency_seconds_sum{action="Search", status="success"} 0.06231312599999999
indexer_latency_seconds_count{action="ListFacets", status="success"} 1
indexer_latency_seconds_count{action="Search", status="success"} 47
Requests In Flight: gauge with the number of inflight requests being handled at the same time.
actionis the index read operation that could be eitherListFacetsorSearch
indexer_inflight_requests{action="ListFacets"} 0
indexer_inflight_requests{action="Search"} 0
Collecting
Explorer collecting path is composed of three components exporting metrics:
- Cluster Watcher Manager
- Datastore Writes
- Indexer Writes
The following metrics are available to monitor its health.
Cluster Watcher
The metric collector_cluster_watcher provides the number of the cluster watchers it the following status:
- Starting: a cluster watcher is starting at the back of detecting that a new cluster has been registered.
- Started: cluster watcher has been started and collecting events from the remote cluster. This is the stable state.
- Stopping: a cluster has been deregistered so its cluster watcher is no longer required. In the process of stopping it.
- Failed: a cluster watcher has failed during the creation or starting process and cannot collect events from the remote clusters. This is the unstable state.
Where collector is the type of collector, it could be
- rbac: for collecting RBAC resources (ie roles)
- objects: for collecting non-rbac resources (ie kustomizations)
collector_cluster_watcher{collector="objects", status="started"} 1
collector_cluster_watcher{collector="objects", status="starting"} 0
collector_cluster_watcher{collector="rbac", status="started"} 1
collector_cluster_watcher{collector="rbac", status="starting"} 0
A sum on collector_cluster_watcher gives the total number of cluster watchers that should be equal to the number of clusters
Datastore Writes
Request Latency: histogram with the latency of the datastore write requests.
actionis the datastore write operation that could be eitherStoreRoles,StoreRoleBindings,StoreObjects,DeleteObjects,DeleteAllObjects,DeleteRoles,DeleteAllRoles,DeleteRoleBindings,DeleteAllRoleBindingsstatusis the result of the operation. It could be either read operation that could be eithersuccessorerror
datastore_latency_seconds_bucket{action="StoreRoles", le="+Inf", status="success"} 1175
datastore_latency_seconds_bucket{action="StoreRoles", le="0.01", status="success"} 1174
datastore_latency_seconds_count{action="StoreRoles",  status="success"} 1175
datastore_latency_seconds_count{action="DeleteRoles",  status="success"} 47
datastore_latency_seconds_count{action="DeleteAllRoleBindings",  status="success"} 47
datastore_latency_seconds_sum{action="StoreRoles",  status="success"} 0.6924557999999995
datastore_latency_seconds_sum{action="DeleteRoles",  status="success"} 1.329158916
datastore_latency_seconds_sum{action="DeleteAllRoleBindings",  status="success"} 3.942473879999999
Requests In Flight: gauge with the number of inflight write requests being handled at the same time.
actionis the datastore write operation that could be eitherStoreRoles,StoreRoleBindings,StoreObjects,DeleteObjects,DeleteAllObjects,DeleteRoles,DeleteAllRoles,DeleteRoleBindings,DeleteAllRoleBindings
datastore_inflight_requests{action="StoreRoles"} 0
datastore_inflight_requests{action="StoreRoleBindings"} 0
datastore_inflight_requests{action="DeleteAllRoleBindings"} 0
Indexer Writes
Request Latency: histogram with the latency of the indexer write requests.
actionis the index write operation that could be eitherAdd,RemoveorRemoveByQuerystatusis the result of the operation. It could be eithersuccessorerror
indexer_latency_seconds_bucket{action="Add",status="success",le="+Inf"} 109
indexer_latency_seconds_bucket{action="Remove",status="success",le="+Inf"} 3
indexer_latency_seconds_sum{action="Add",status="success"} 8.393912168
indexer_latency_seconds_sum{action="Remove",status="success"} 0.012298476
indexer_latency_seconds_count{action="Add",status="success"} 109
indexer_latency_seconds_count{action="Remove",status="success"} 3
Requests In Flight: gauge with the number of inflight requests being handled at the same time.
actionis the index write operation that could be eitherAdd,RemoveorRemoveByQuery
indexer_inflight_requests{action="Add"} 0
indexer_inflight_requests{action="Remove"} 0
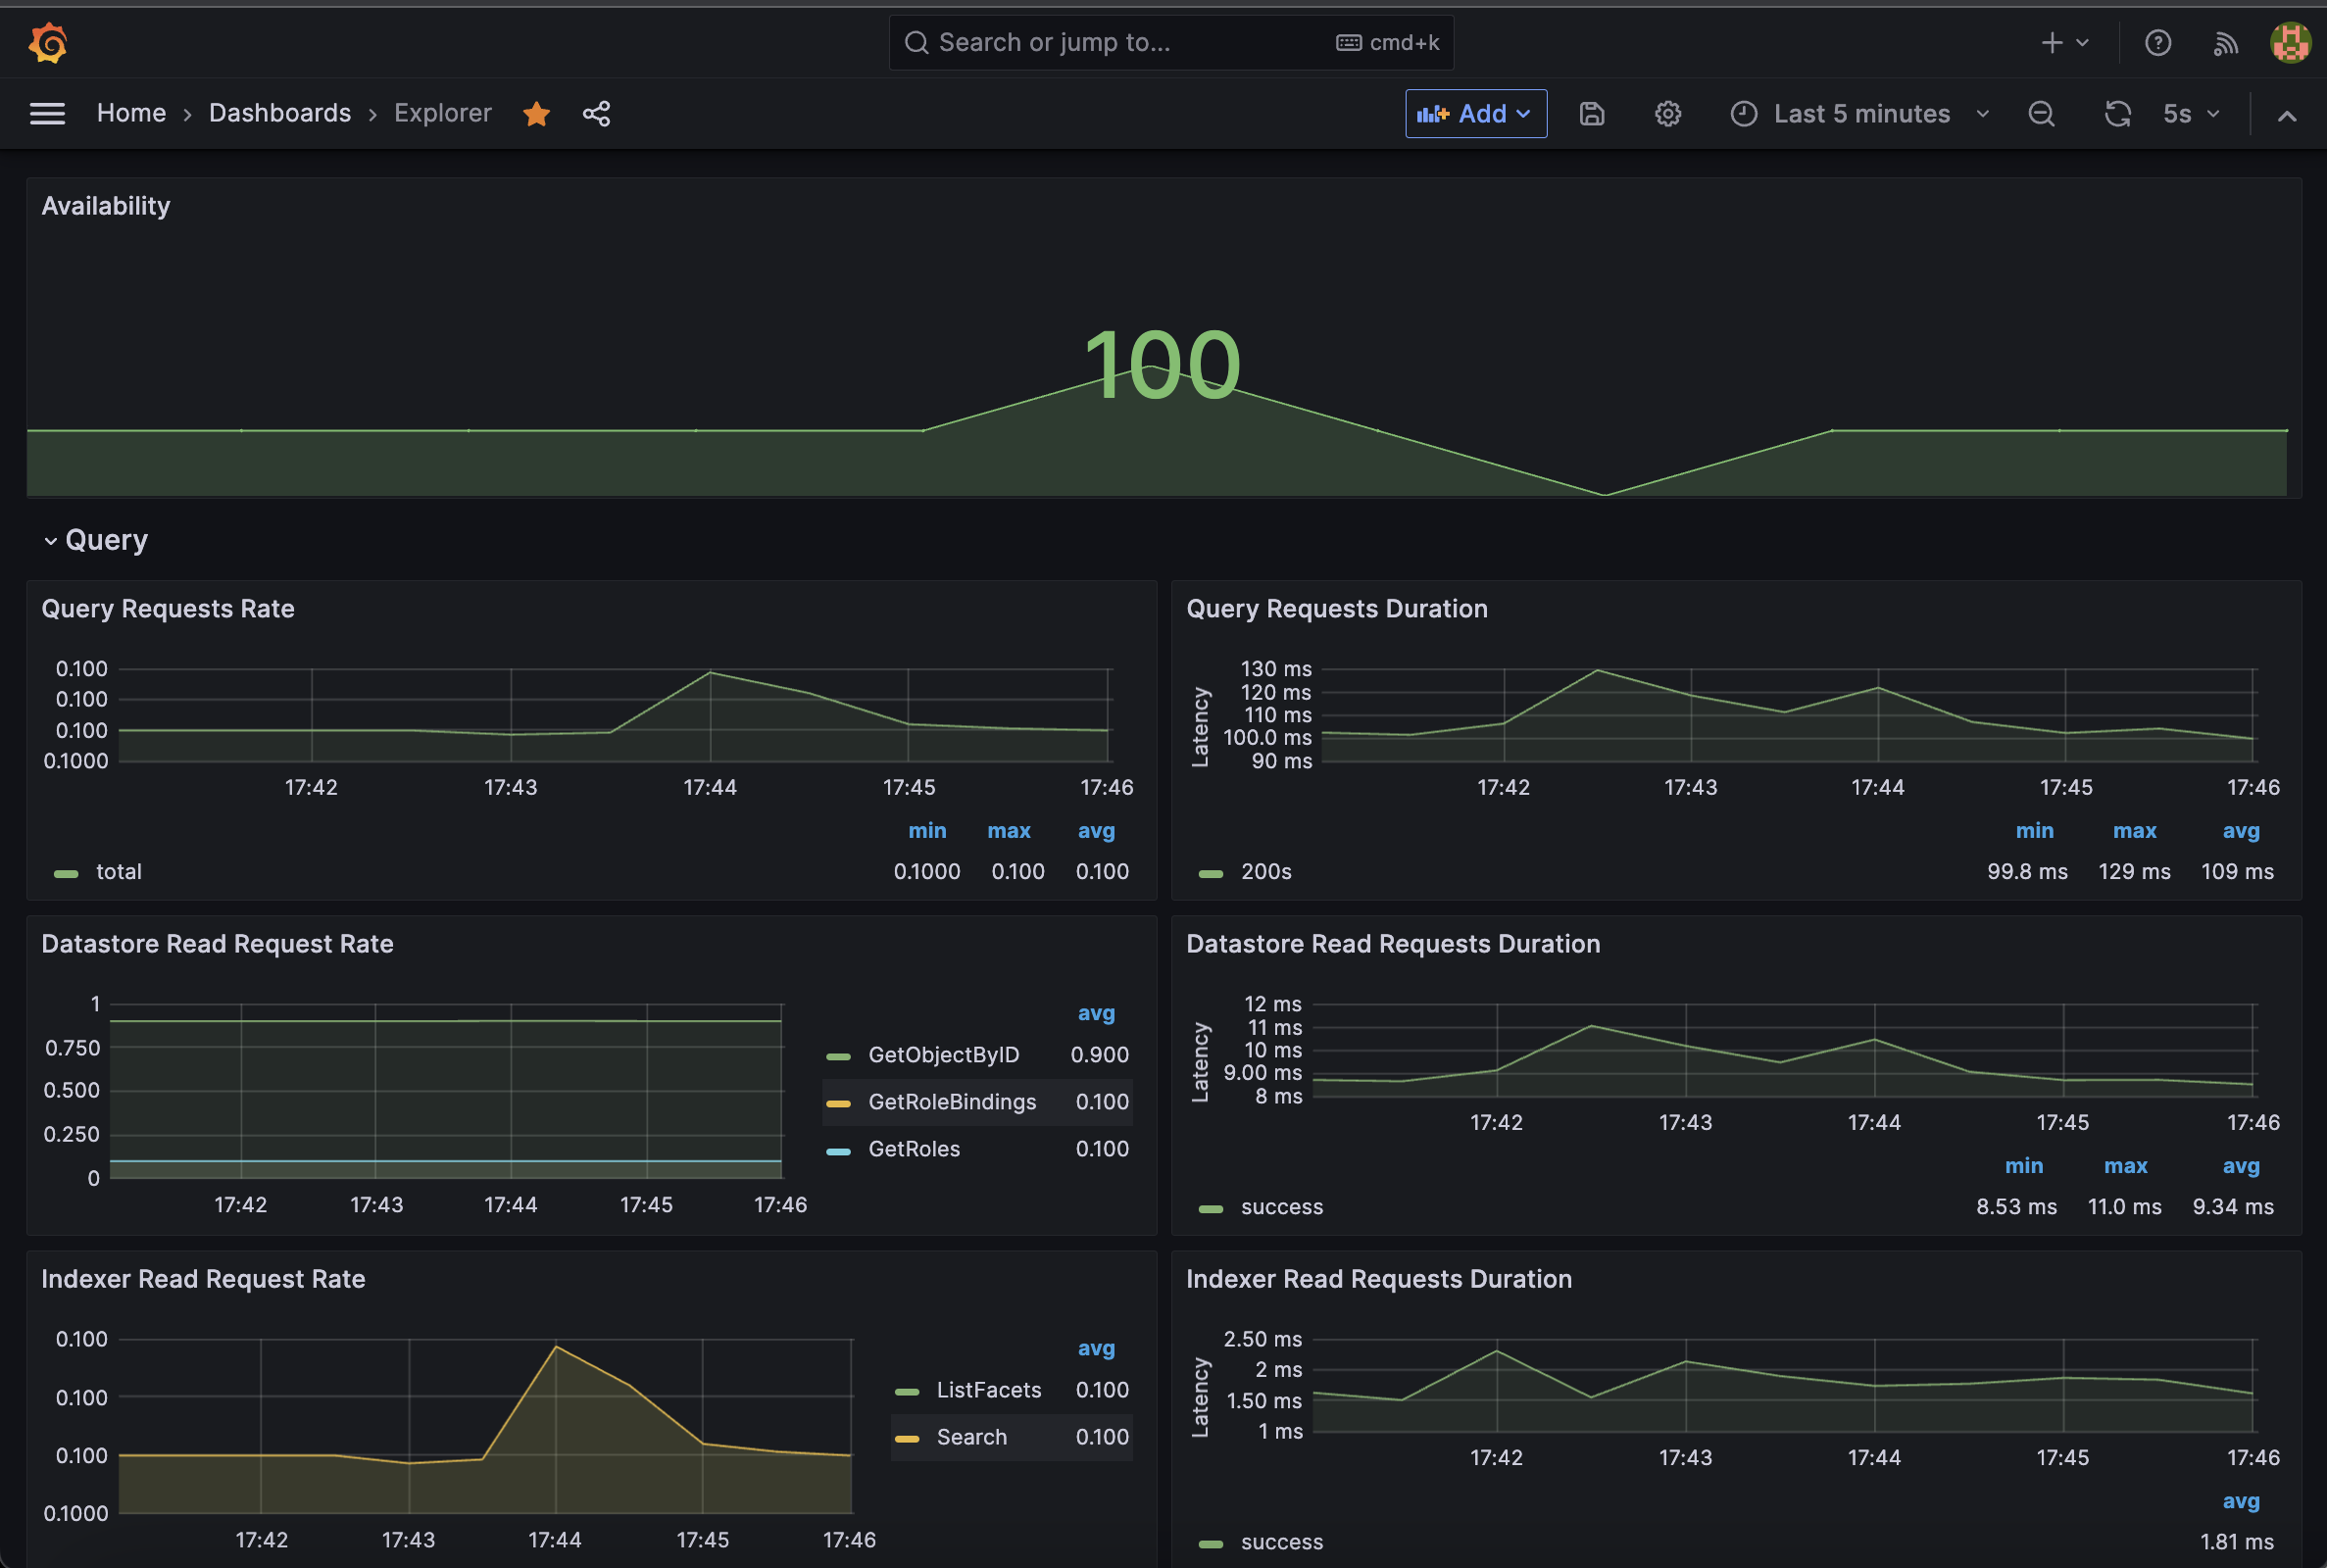
Dashboard
You could leverage this grafana dashboard in Grafana to monitor its golden signals