Monitoring Enterprise
Weave GitOps Enterprise provides the following telemetry and tooling for monitoring:
Setup
The following configuration options are available for you to configure montoring:
---
apiVersion: helm.toolkit.fluxcd.io/v2beta1
kind: HelmRelease
metadata:
  name: weave-gitops-enterprise
  namespace: flux-system
spec:
  values:
    monitoring:
      enabled: true # enable it if you want to expose a monitoring server
      service:
        name: monitoring
        port: 8080 # port to expose the monitoring server
      metrics:
        enabled: true # enable it to expose a prometheus metrics endpoint in `/metrics`
      profiling:
        enabled: false # enable it to expose a pprof debug endpoint  `/debug/pprof`
The monitoring server holds private services, so you likely do not require to expose beyond your cluster. In case you need, ensure that it is properly secured.
Metrics
It generates Prometheus metrics for monitoring both performance and business operations.
Get Started
This setup follows Flux Monitoring approach based on Prometheus Operator. Adapt it to your context as needed.
- You have enabled the monitoring server with the metrics endpoint.
- Install Kube Prometheus Stack.
Expand to see manifest contents
apiVersion: source.toolkit.fluxcd.io/v1
kind: GitRepository
metadata:
  name: weave-gitops-quickstart
  namespace: flux-system
spec:
  interval: 10m0s
  ref:
    branch: main
  url: https://github.com/weaveworks/weave-gitops-quickstart
---
apiVersion: v1
kind: Namespace
metadata:
  name: monitoring
---
apiVersion: kustomize.toolkit.fluxcd.io/v1
kind: Kustomization
metadata:
  name: kube-prometheus-stack
  namespace: flux-system
spec:
  interval: 10m0s
  sourceRef:
    kind: GitRepository
    name: weave-gitops-quickstart
  path: ./monitoring/kube-prometheus-stack
  prune: true
  targetNamespace: monitoring
  wait: true
- Deploy Weave GitOps Monitoring Config
Expand to see manifest contents
apiVersion: kustomize.toolkit.fluxcd.io/v1
kind: Kustomization
metadata:
  name: monitoring-config
  namespace: flux-system
spec:
  interval: 10m0s
  sourceRef:
    kind: GitRepository
    name: weave-gitops-quickstart
  path: ./monitoring/weave-gitops
  dependsOn:
    - name: kube-prometheus-stack
  prune: true
  targetNamespace: monitoring
- See the dashboards in Grafana
You could filter by tags flux or weave-gitops
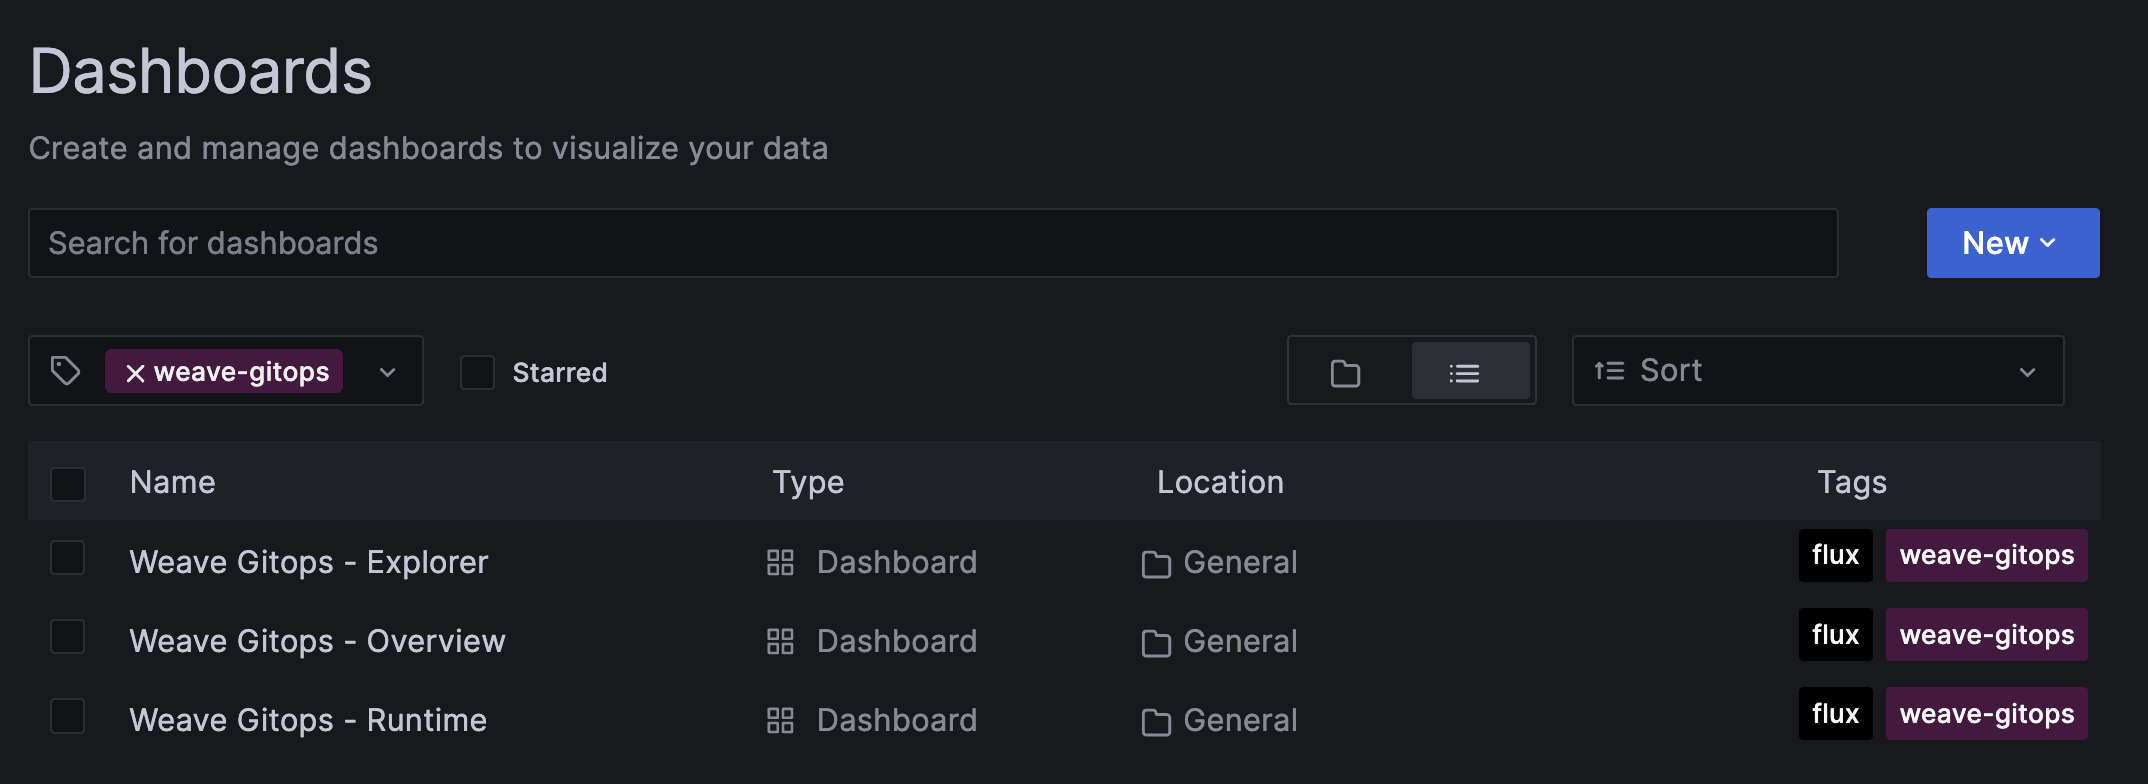
Dashboards
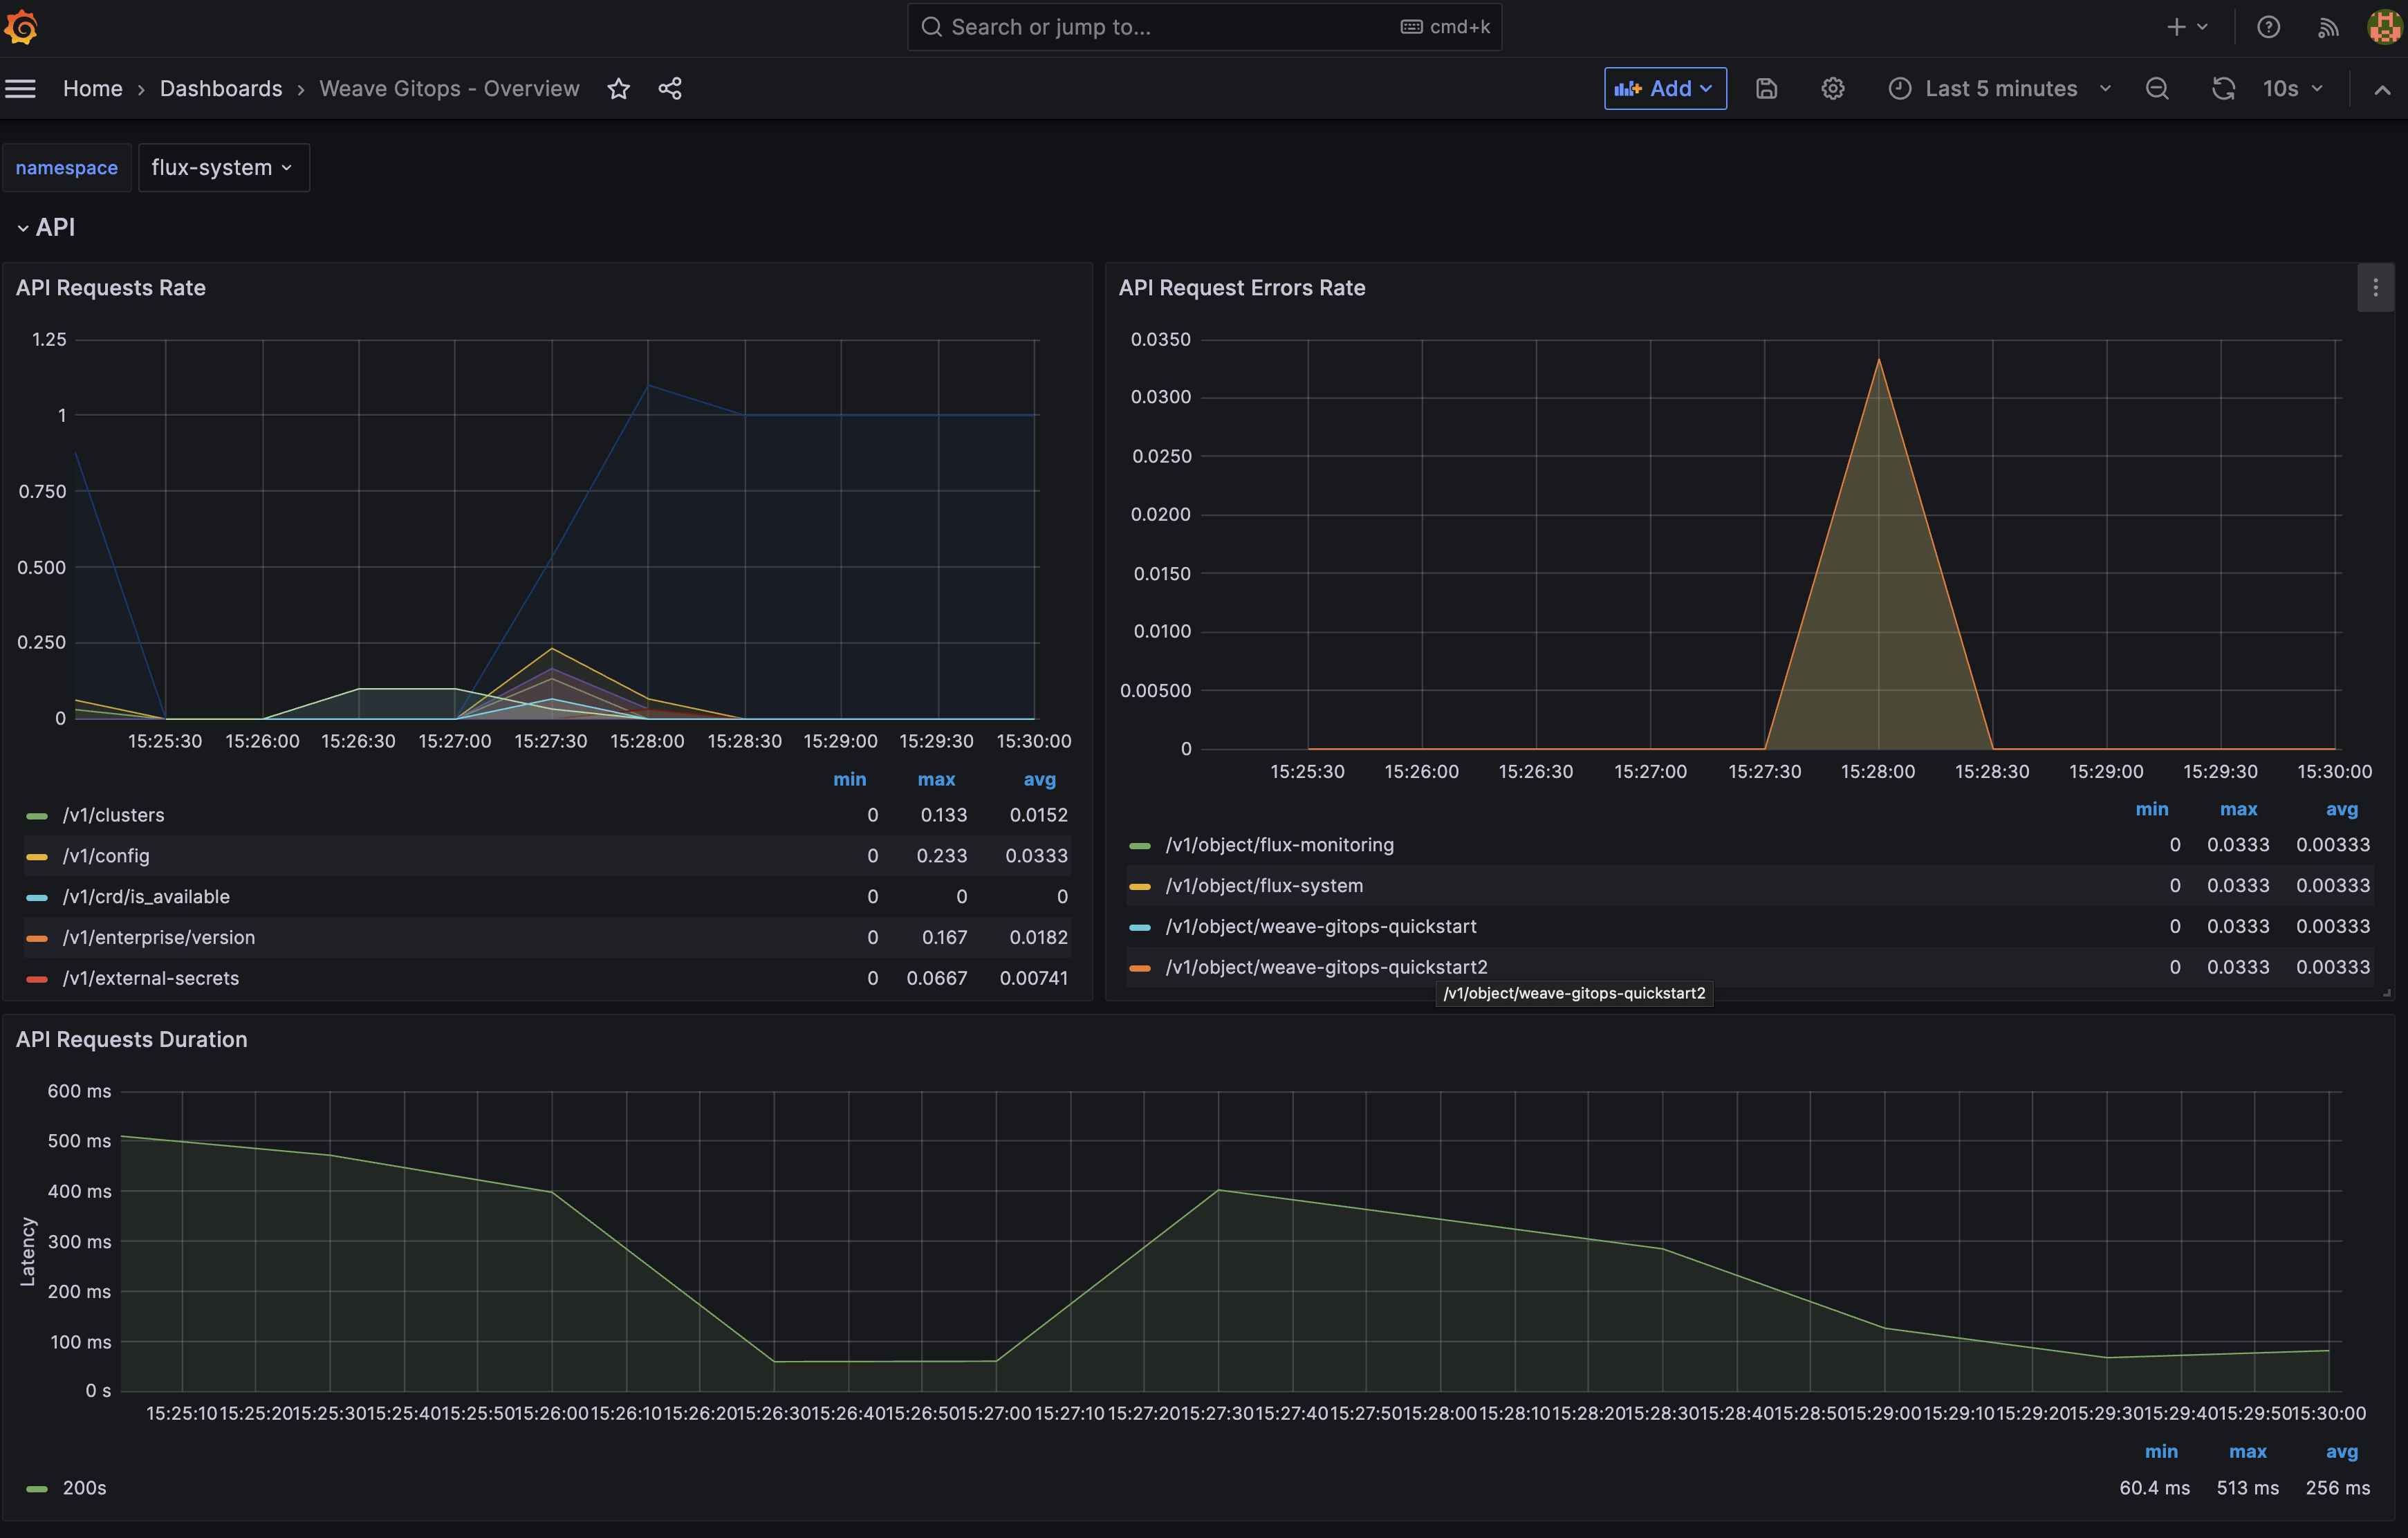
Weave Gitops Overview
Monitor Weave Gitops golden signals for API server and Controllers:
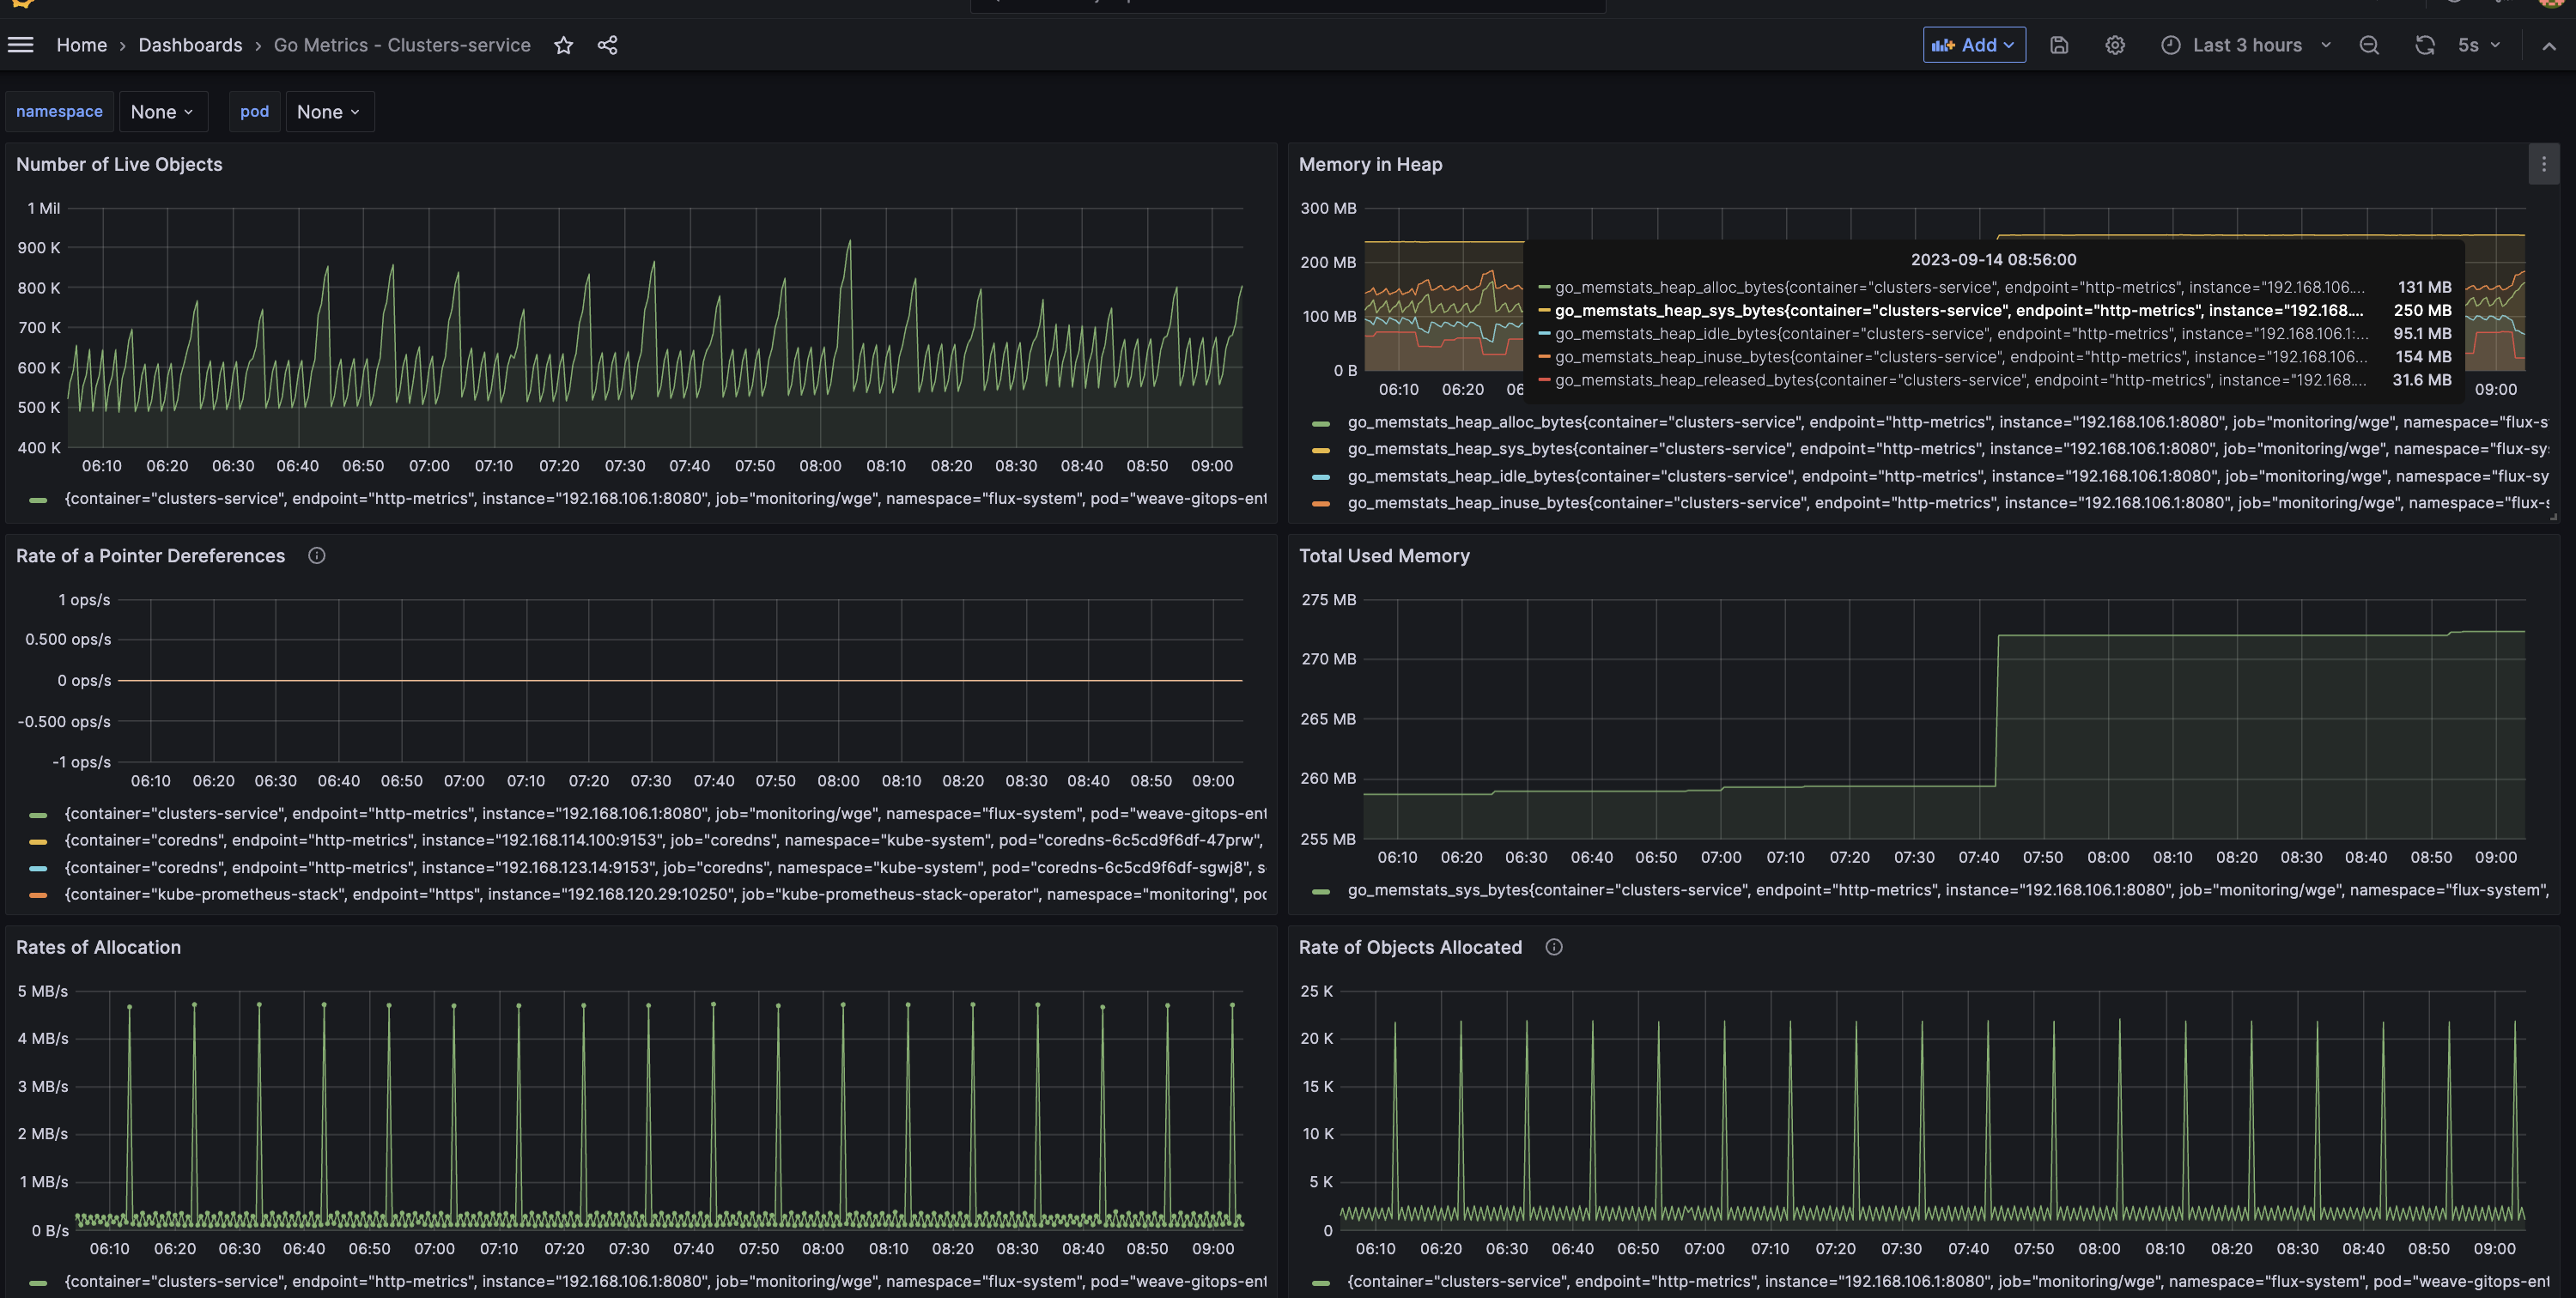
Weave Gitops Runtime
Monitor Weave Gitops GO runtime metrics like Memory Usage, Memory Heap, Goroutines, etc ...
Explorer
Monitor Explorer golden signals. More info here
Profiling
Profiling can be useful during operations to help you to gain a deeper understanding, of how weave gitops runtime behaves. Given Weave GitOps is written in Go, profiling happens through pprof, and it is exposed as web endpoint by pprof http.
Get Started
- You have enabled the monitoring server with the profiling endpoint.
- Navigate to your monitoring server URL to the
/debug/pprofpath where the pprof web interface is exposed.
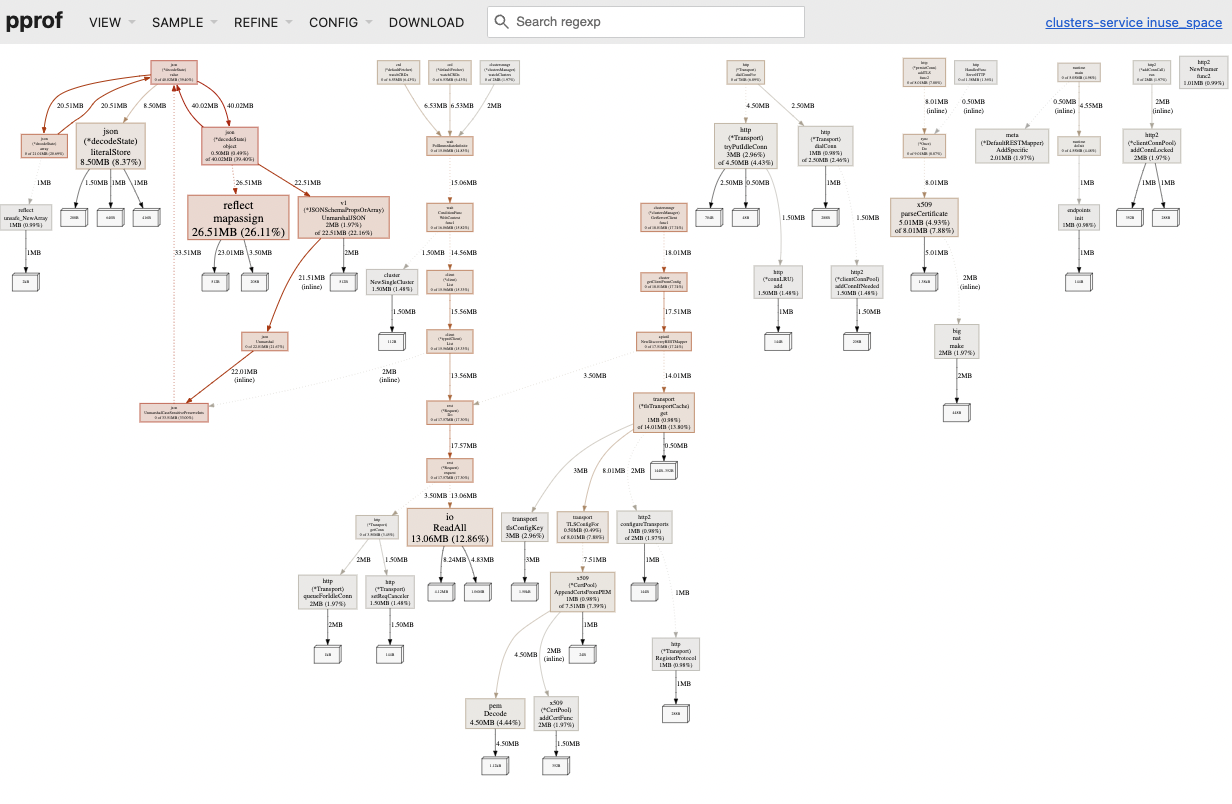
For further info on using pprof see here