Step 2: Explore the Weave GitOps Open Source UI
The Weave GitOps user interface enables you to manage and view all of your applications in one place. This documentation gives you an overview of the Weave GitOps Open Source UI.
To check out Weave GitOps Enterprise's UI, which provides an even richer user experience, please contact sales@weave.works.
Overview
A quick preview of what the Weave GitOps Open Source UI provides:
- an Applications view that shows summary information from
KustomizationandHelmReleaseobjects so that you can quickly understand the state of your deployments across a cluster. - a Sources view that shows summary information from gitrepository, helmrepository and bucket objects and tells you the current status of resources that are synchronizing content from where you’ve declared the desired state of your system—for example, Git repositories.
- a Flux Runtime view that provides the status of the GitOps engine that continuously reconciles your desired and live state. It shows your installed GitOps Toolkit Controllers and version.
- an Image Automation view that reduces GitOps friction, particularly in non-production environments, by enabling you to discover repositories, policies, and updates on your cluster. Deploy the latest image in a dev or staging environment with minimal fuss, and keep your platform updated with the latest approved versions—for example, patch releases to reduce exposure to CVEs. Auto-deploy when approval is gated before the image is added to an internal registry.
- A Notifications View that leverages Flux's notification controller to show which notifications are already configured within the UI. This enables WeGO users to set up and receive notifications from Weave GitOps. Here you can find the list of providers. If you’re a platform operator, this view will help you to understand your egress topology across clusters so you’ll know where events are being sent beyond your clusters.
- multiple views for debugging.
- a dark mode option.
It also enables you to:
- sync your latest Git commits directly from the UI
- leverage Kubernetes RBAC to control permissions in the dashboard
Let's dive in.
Login to the GitOps Dashboard
First, expose the service running on the cluster with this command:
kubectl port-forward svc/ww-gitops-weave-gitops -n flux-system 9001:9001
Next, open the dashboard and login using either the emergency cluster user or OIDC, based on your configuration. (Note: The same directions for WGE apply to OSS for this step.)
If you followed the example above, the emergency user will be configured with the username set to admin. This means that you can use “admin” as your user name, and the password that you set earlier during installation as $PASSWORD.
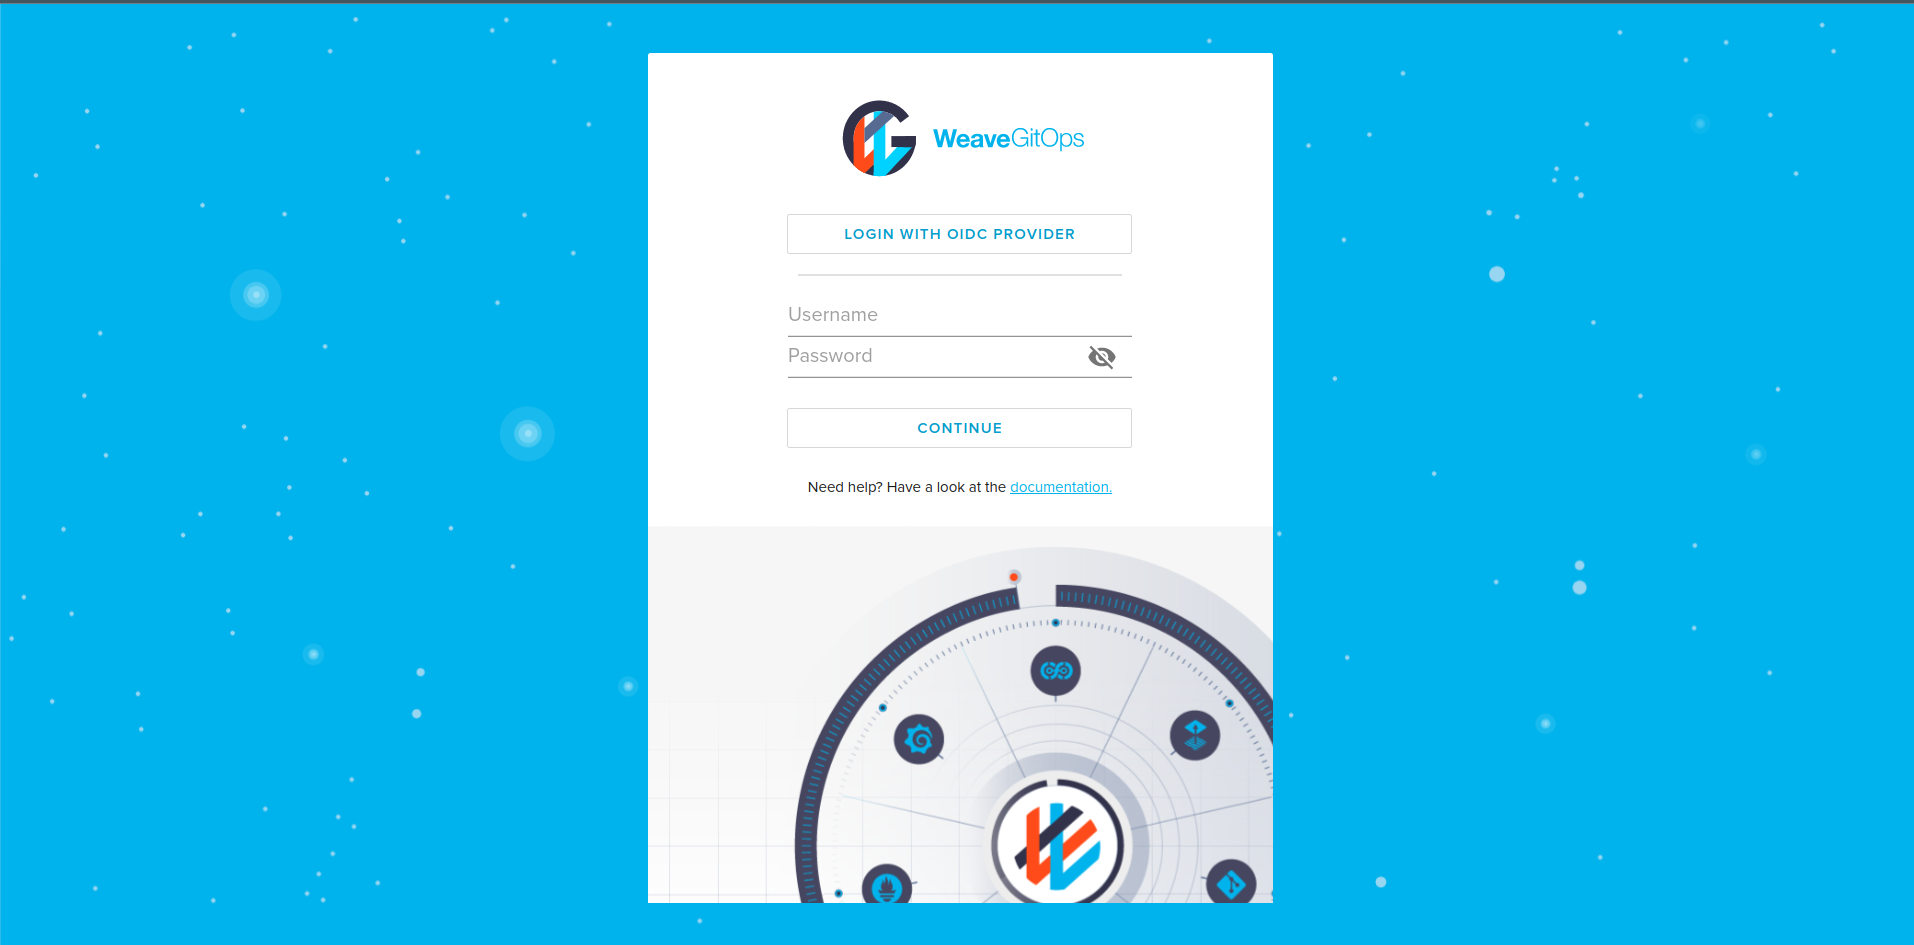
The label of the OIDC button on the login screen is configurable via a feature flag environment variable. This can give your users a more familiar experience when logging in.
Adjust the configuration in the Helm values.yaml file or the spec.values section of the Weave GitOps HelmRelease resource:
envVars:
  - name: WEAVE_GITOPS_FEATURE_OIDC_BUTTON_LABEL
    value: "Login with ACME"
The Applications View
Upon login you're taken to the Applications view, which allows you to quickly understand the state of your deployments and shows summary information from Kustomization and HelmRelease objects. You can apply dark mode using the toggle switch in the top right corner.
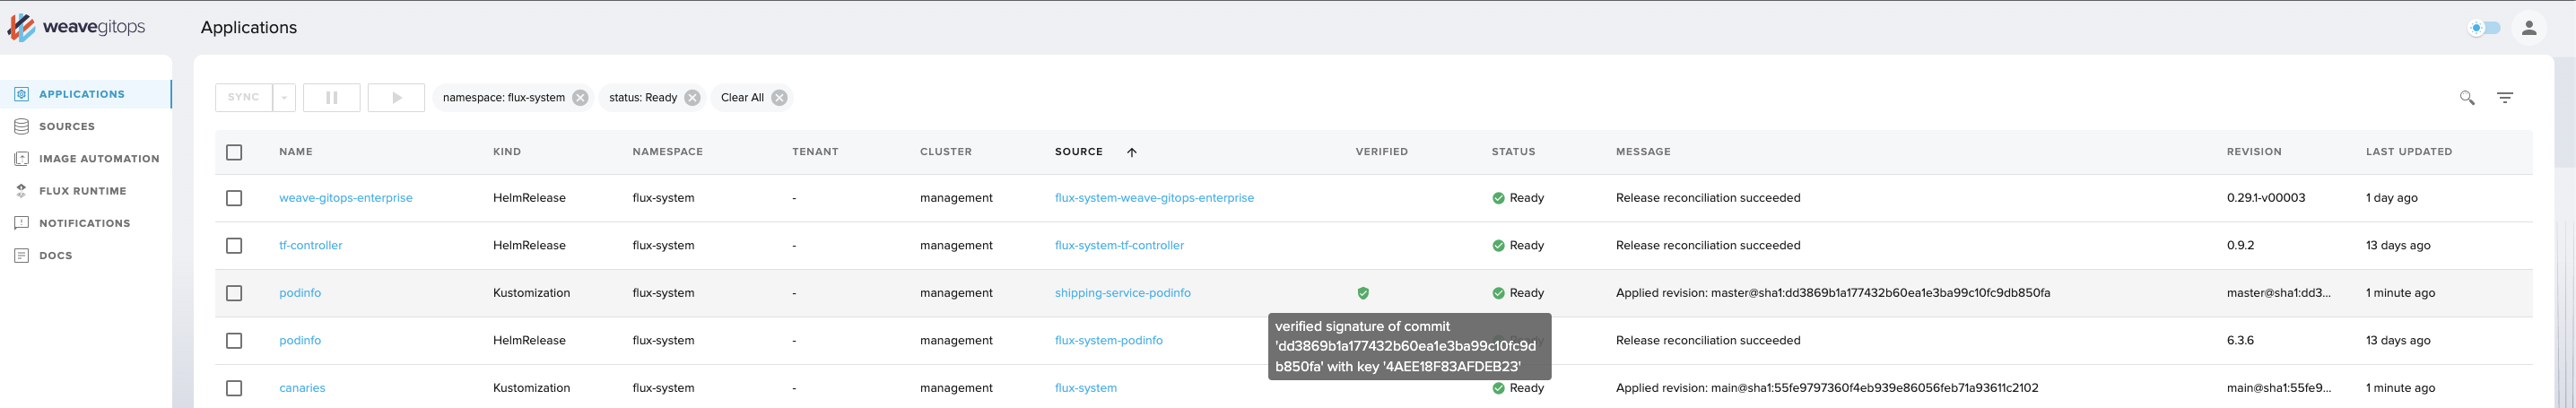
In the above screenshot you can see:
- two
Kustomizationscalledpodinfoandcanariescorresponding to the applications with the same names. The source referenced bypodinfoisshipping-service-podinfowhich has been verified whereas the one referenced bycanariesdoes not have verification set up. - three
HelmReleasescalledweave-gitops-enterprise,tf-controllerandpodinfowhich deploys the respective Helm Charts.
The table view shows you the reported status so you can understand whether a reconciliation has been successful, and when it was last updated. You can also see where the Flux objects are deployed, which Source object they are reconciling from and whether or not that Source is verified (this requires verification to have been set up for the source). Clicking the name of the Source will take you to a detail view for the given Source object. The view automatically updates every few seconds so you know the current state of your system.
For more information about Sources, please take a look at the Flux documentation.
For information on Source verification, you can check:
If verification is not set up for the repository, this will appear blank in the UI.
More actions you can take:
- Click the magnifying glass icon to search for and filter objects by
Name. - Filter by
Typeby clicking the strawberry icon to its right. - Click the
Nameof an object to get a detailed view for the givenKustomizationorHelmRelease. (You'll see this again in the Sources view.) - In the main Applications view, you can use the checkbox to the left of your listed applications to select them and perform actions from the actions menu at the top. These actions are Sync (reconcile), Suspend, and Resume, and they affect Flux resources.
A Closer Look: Exploring the flux-system Deployment
Let's explore the flux-system Kustomization. Navigate back to the Applications view, and click on the flux-system object.
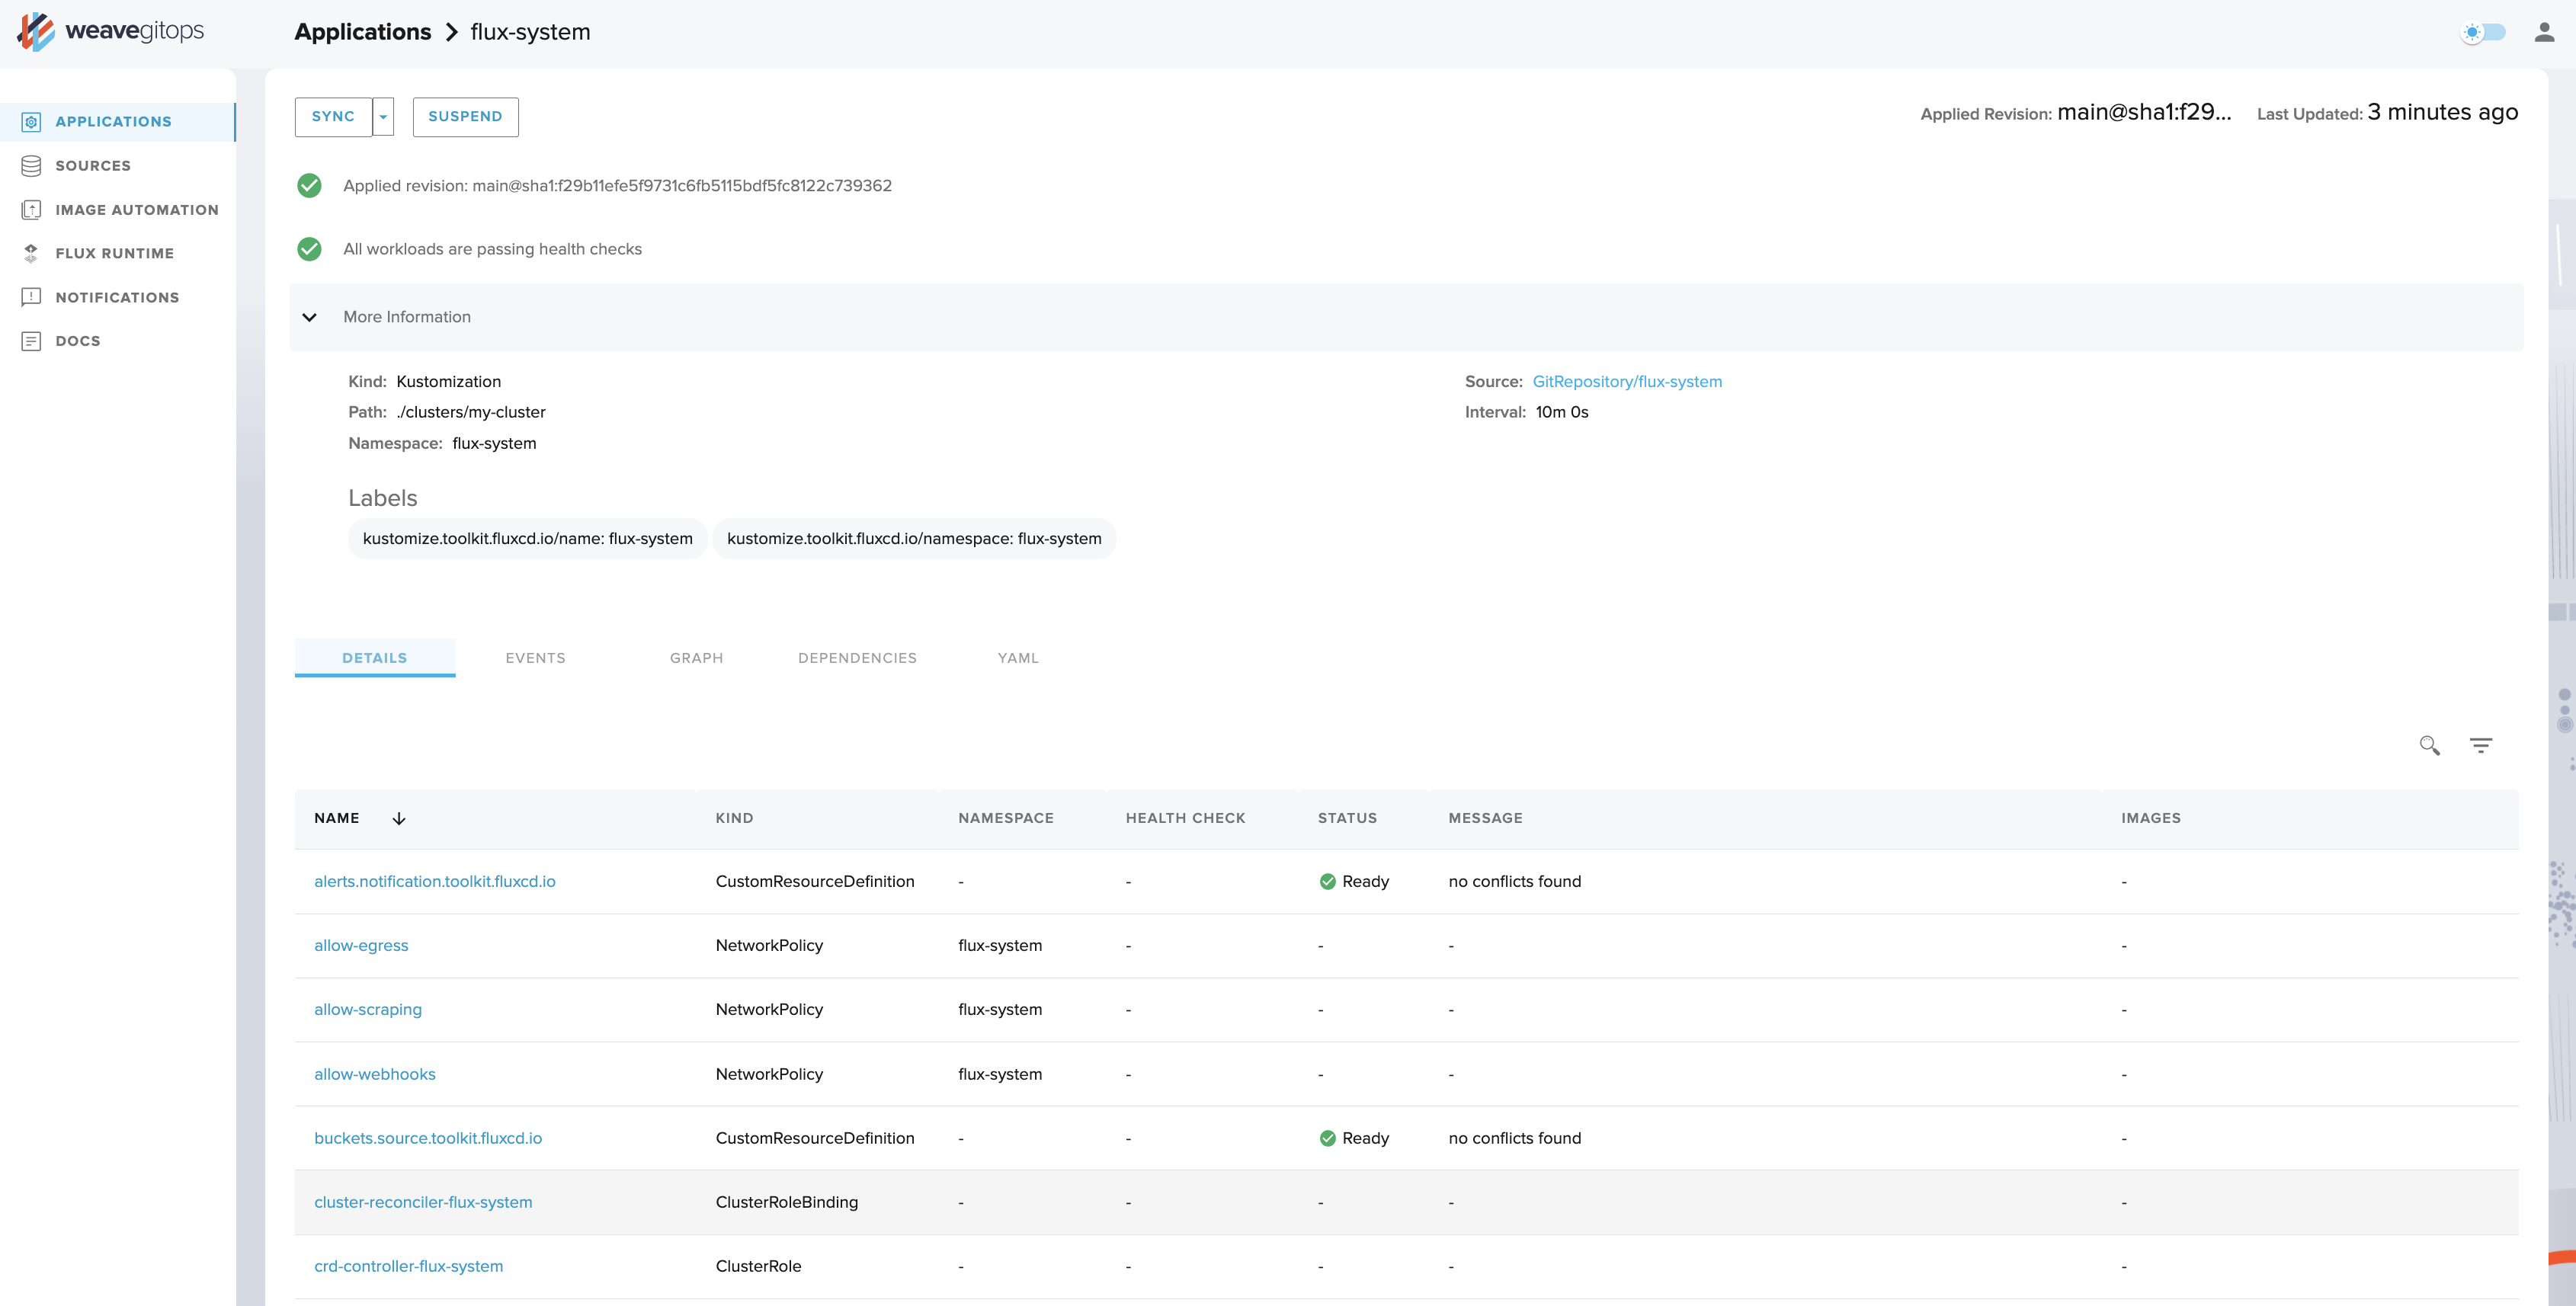
It might take a few moments for the data to load. Once it does, you should get a result that resembles the above screenshot. Here you can find key information about how the resource is defined:
- which
Sourceit is reading from - the latest applied commit
- the exact path with the Source repository that is being deployed
- the
Intervalwhere Flux will look to reconcile any differences between the declared and live state. For example, if akubectlpatch has been applied on the cluster, it will effectively be reverted. If a longer error message is reported by this object, you'll be able to see it in its entirety on this page.
Underneath the summary information you'll find:
- The Details (default) table view, which shows all the Kubernetes objects (including Flux objects, deployments, pods, services, etc.) managed and deployed through this
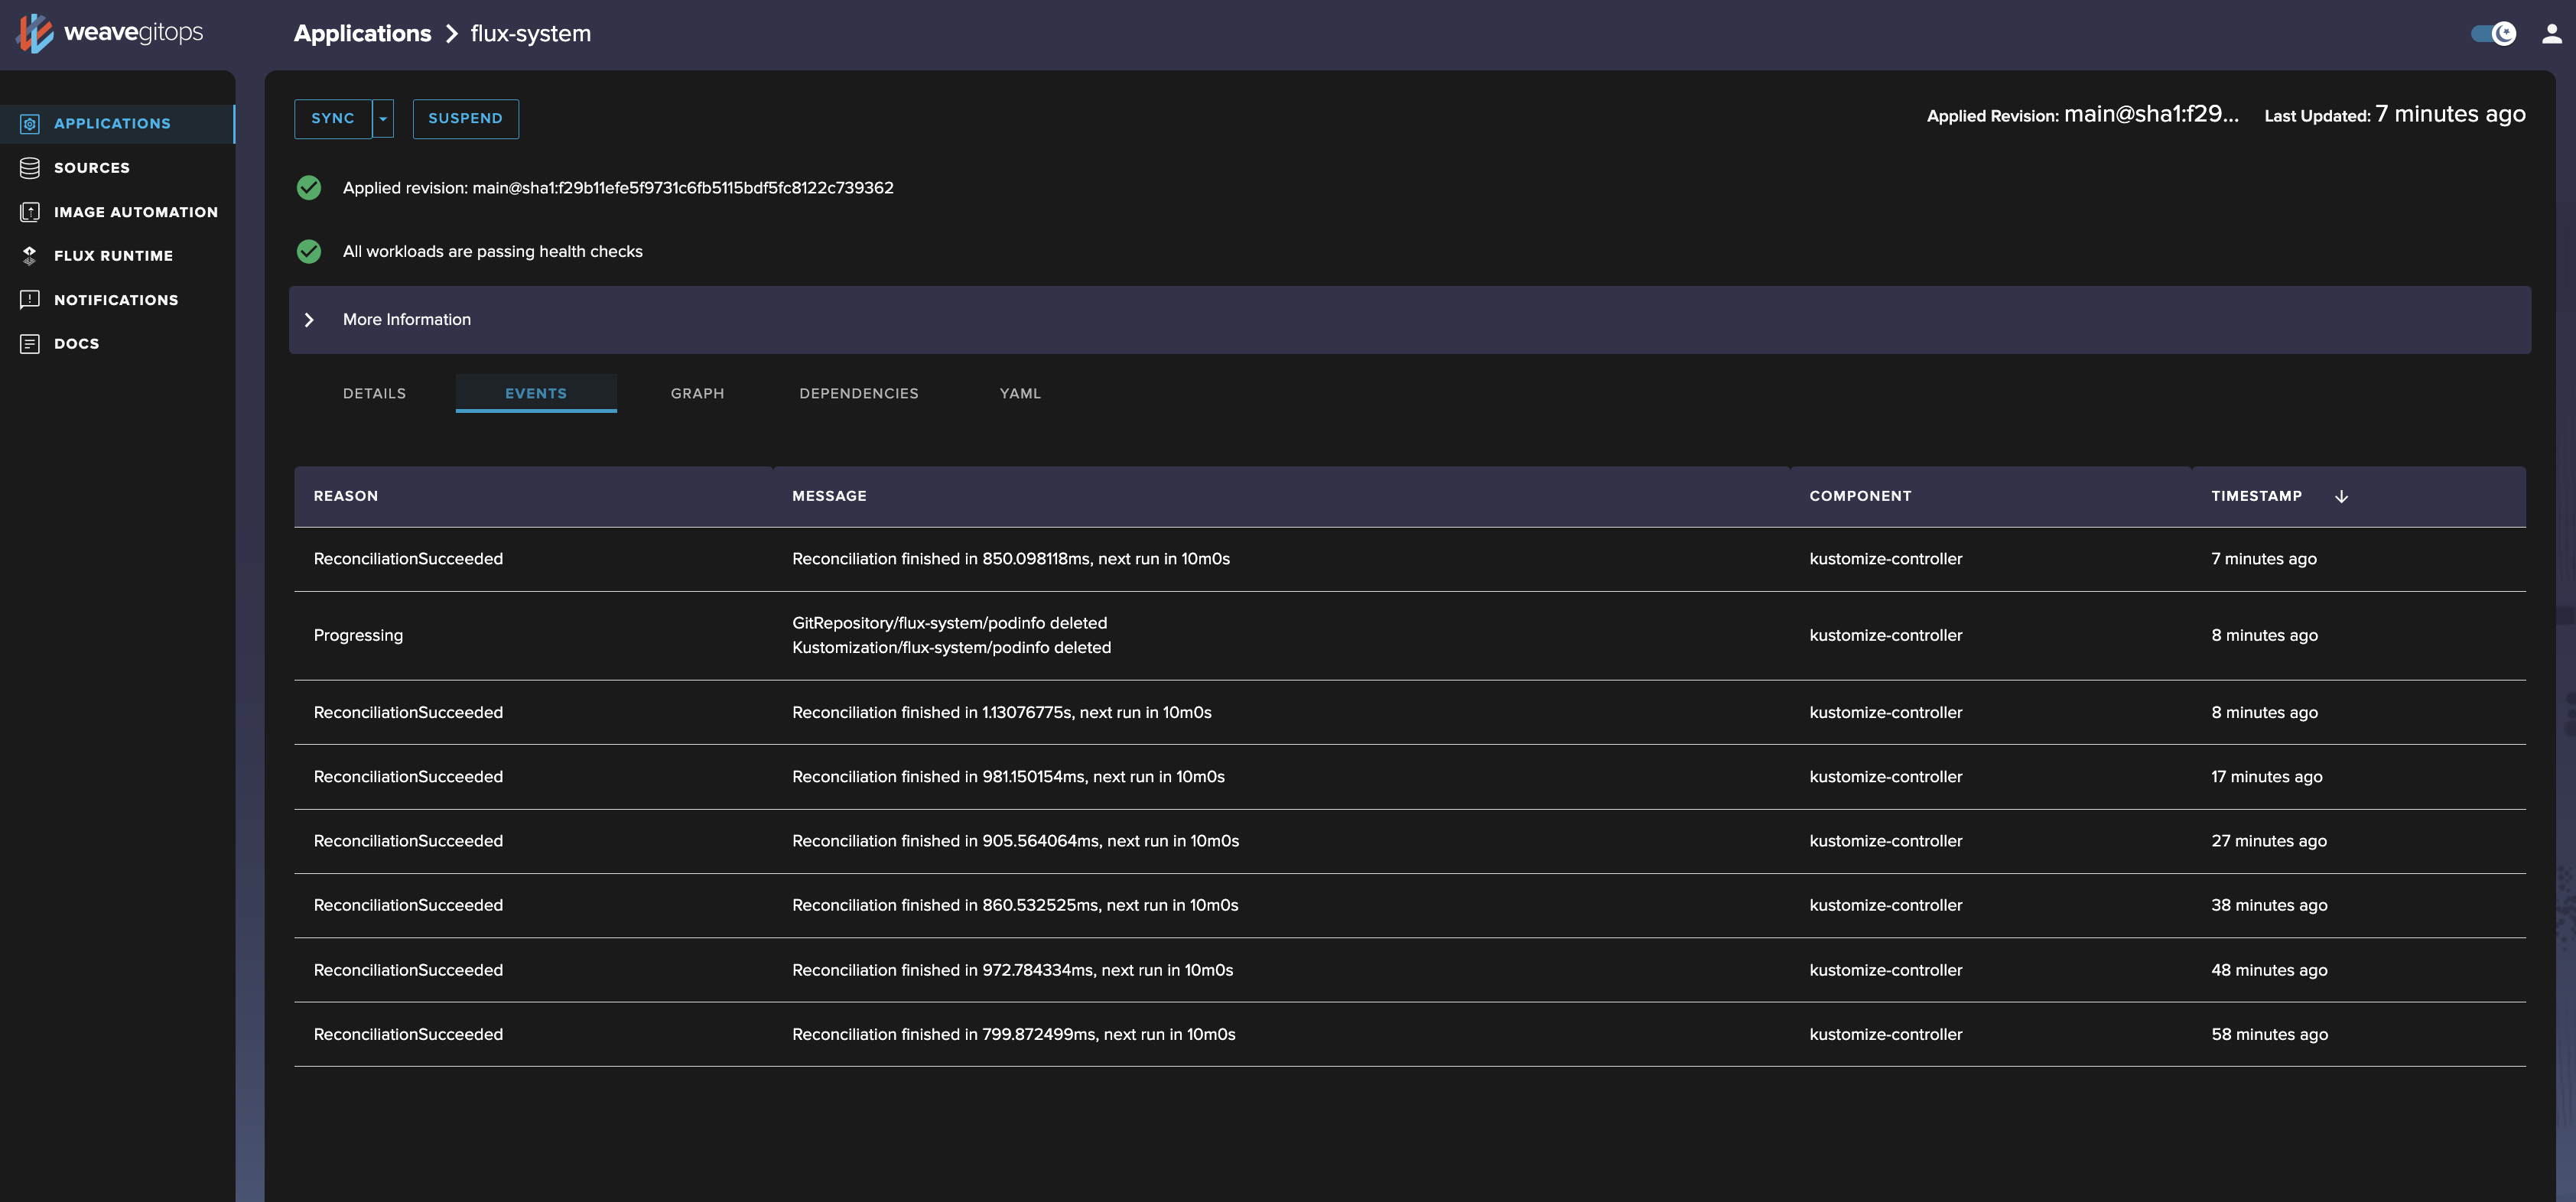
kustomization. - The Events tab (shown below), which shows related Kubernetes events to help you diagnose issues and understand health over time.
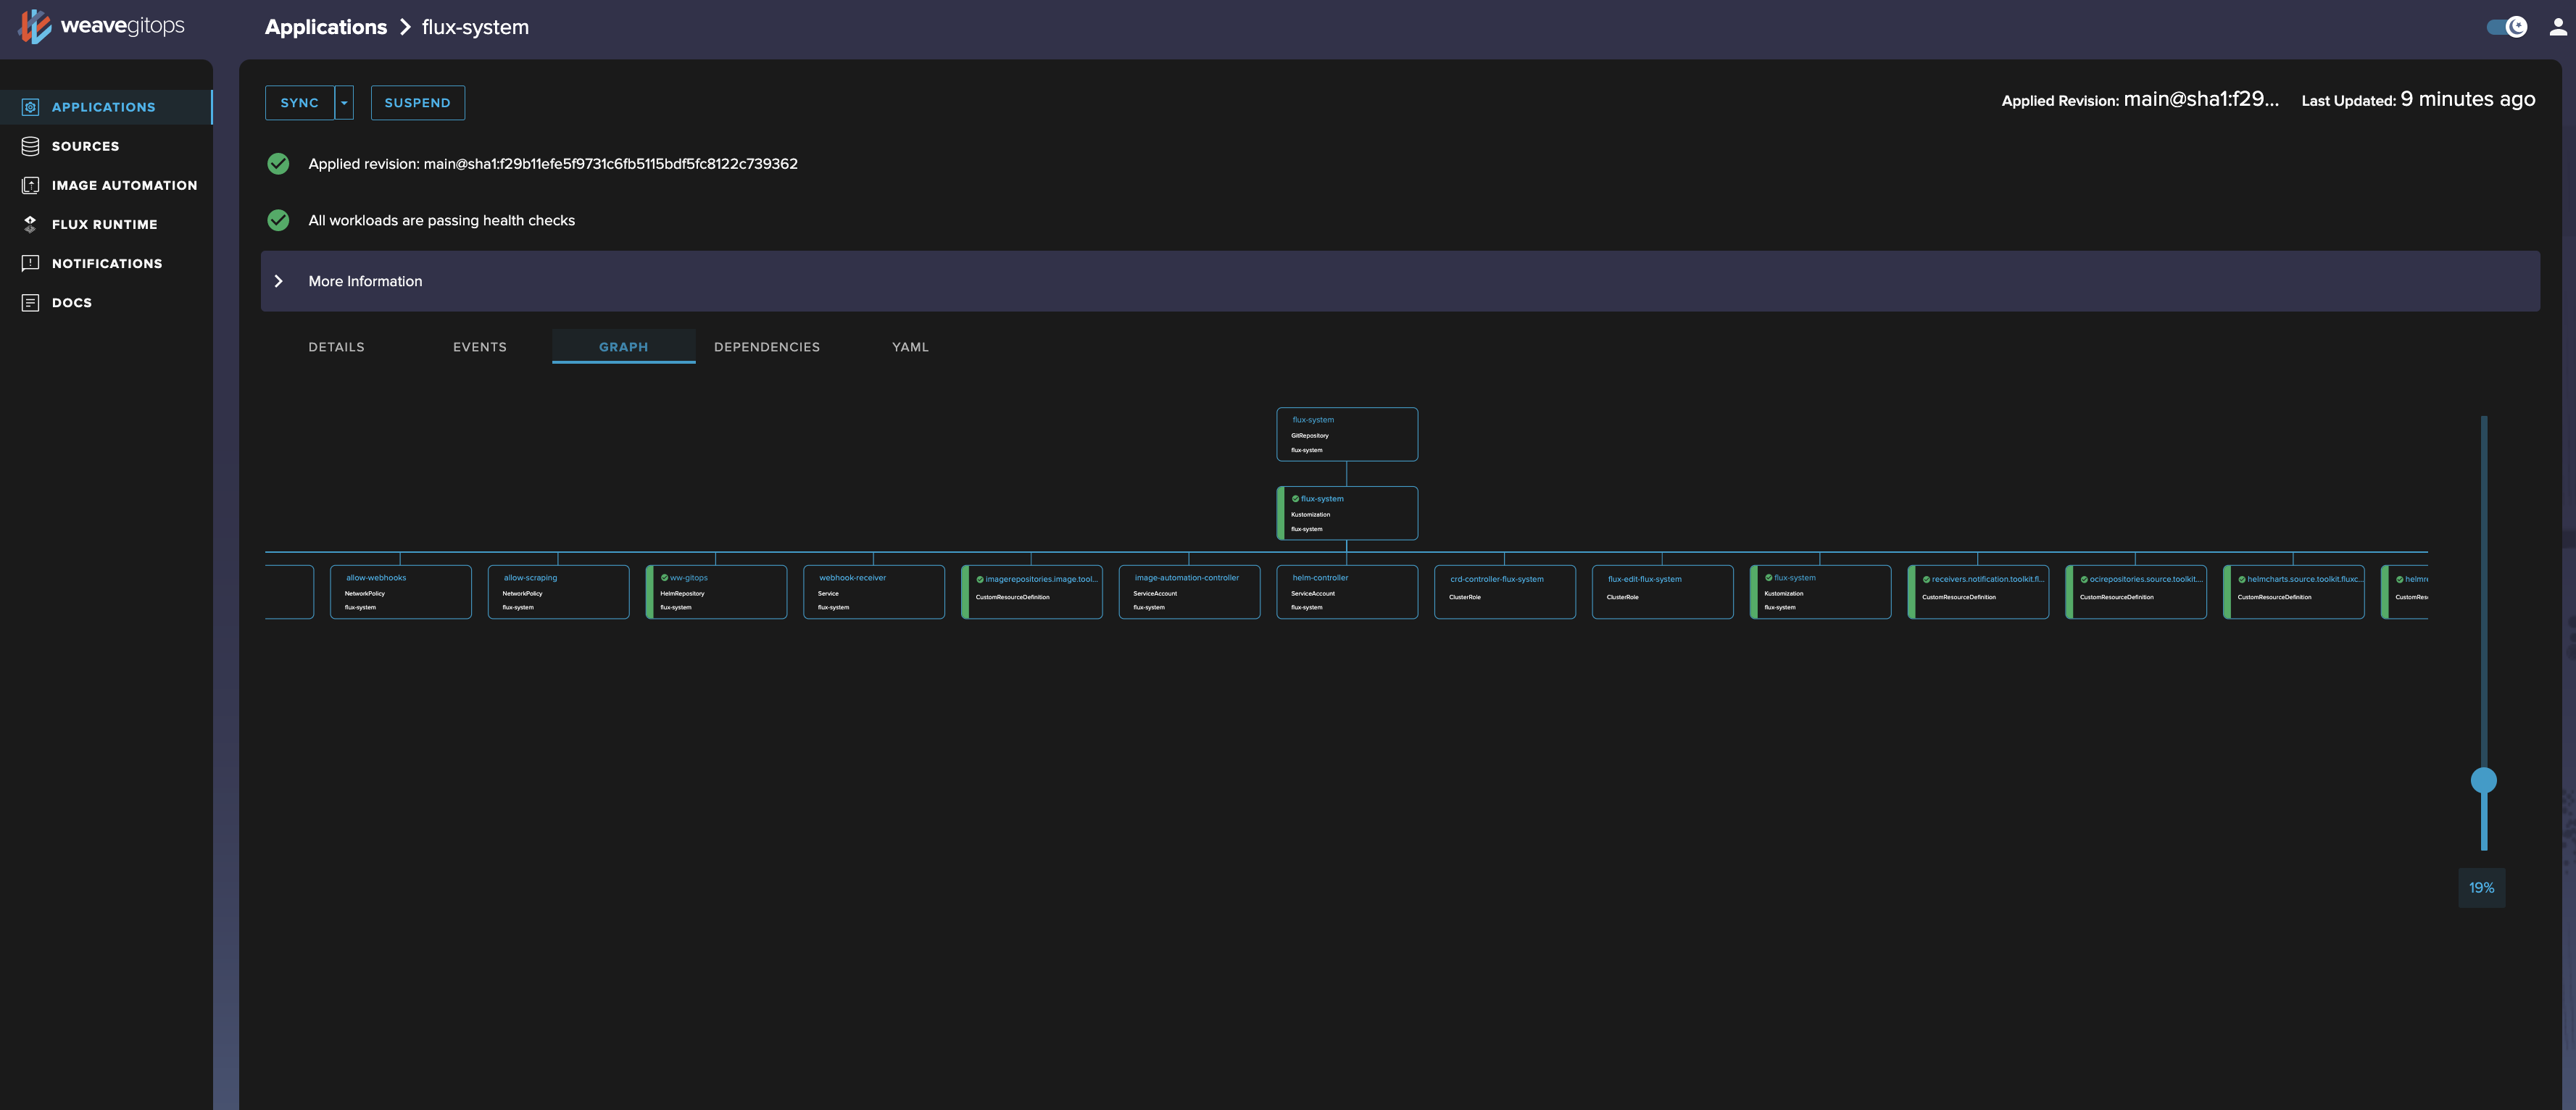
- The Reconciliation Graph (shown below), which provides an alternative to the Details view and helps you to understand how various objects relate to each other.
- Dependencies, which provides a directional graph to help you clarify any dependencies between objects and ensure that your automations are set up in the correct order.
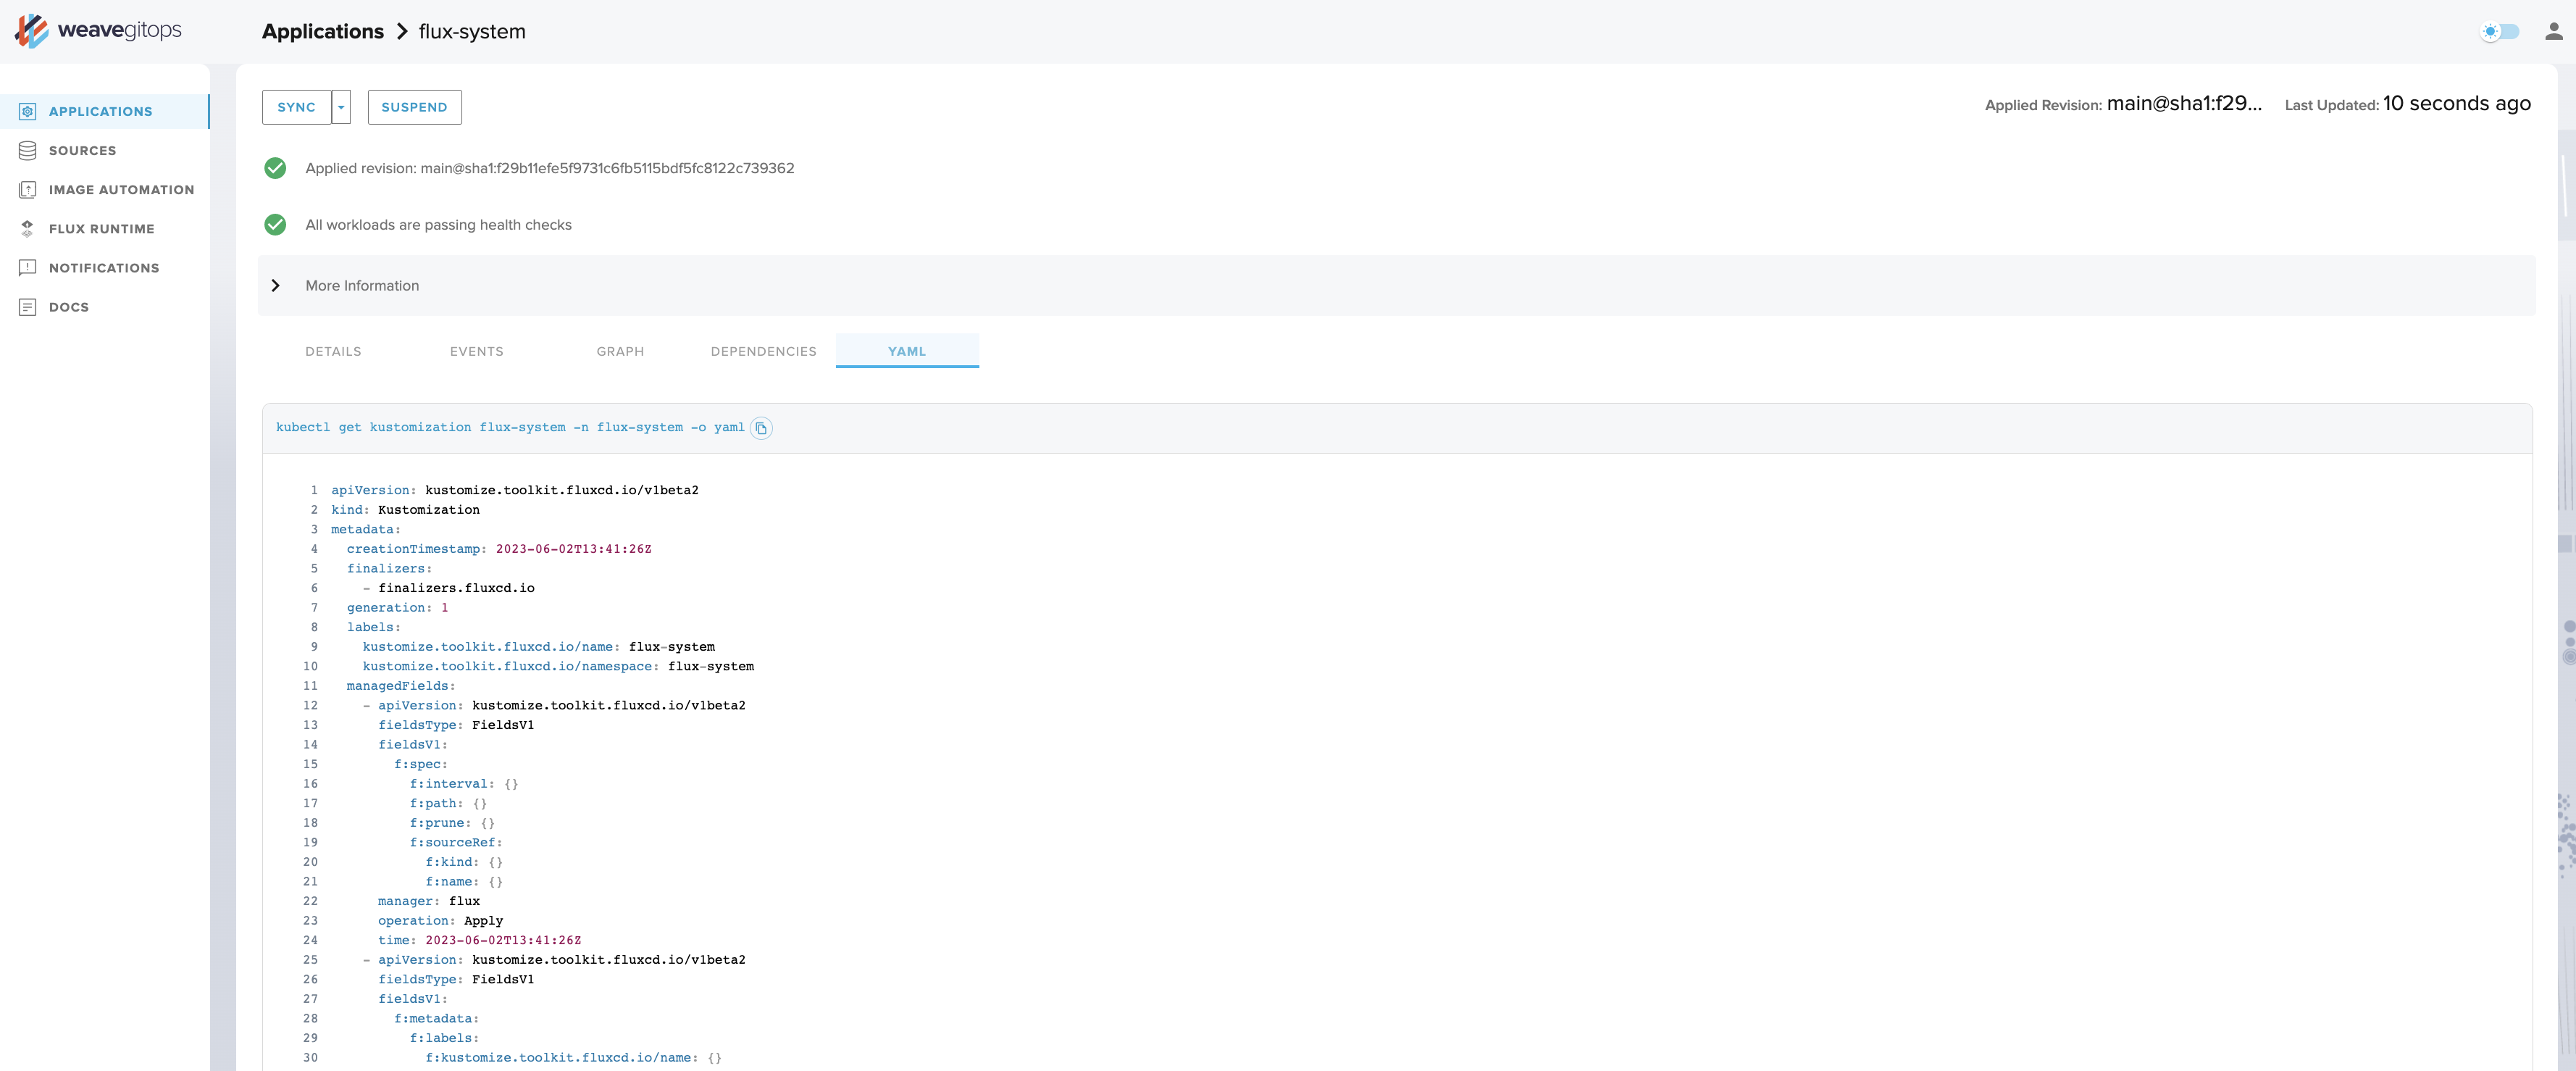
- Yaml (shown below), which provides a raw dump yaml view on the object as it currently exists inside your cluster. Note that this will be different from what's in your GitOps repository.
Events tab
Reconciliation Graph tab
Yaml tab
The Sources View
In the left-hand menu of the UI, click on the Sources view. This will show you where Flux pulls its application definitions from—for example, Git repositories—and the current state of that synchronization. Sources shows summary information from GitRepository, HelmRepository, HelmChart, and Bucket objects.
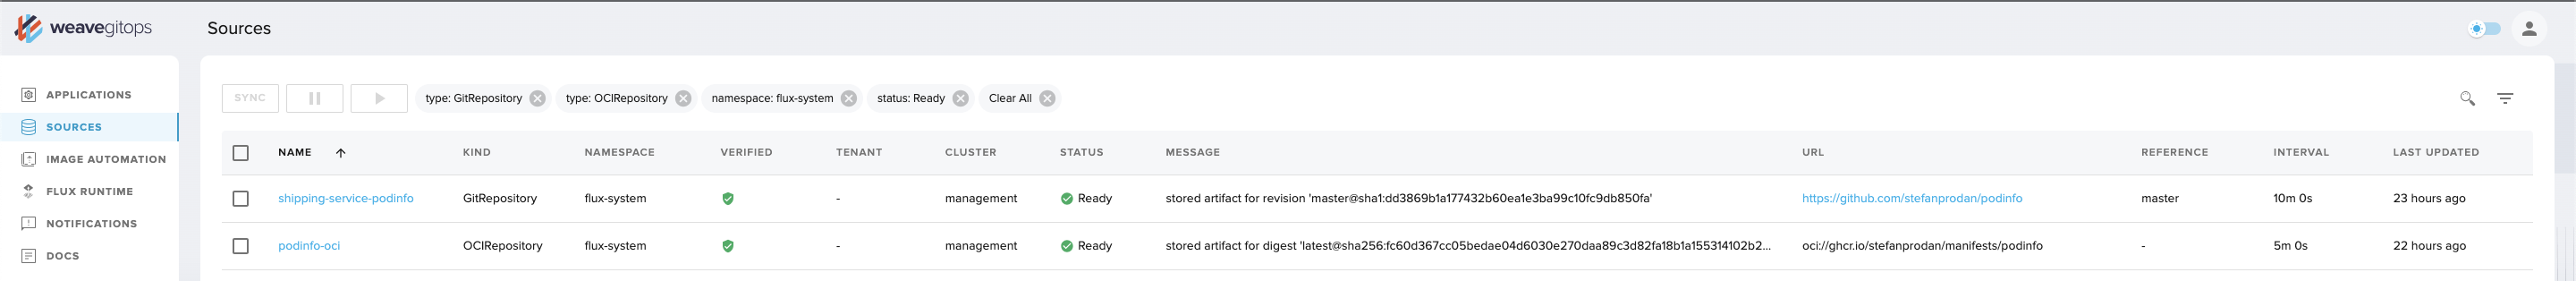
In the above screenshot you can see:
- a
GitRepositorycalledshipping-service-podinfo - an
OCIRepositorycalledpodinfo-oci
These have both had verification set up on them which has been completed successfully.
The Sources table view displays information about status so that you can see whether Flux has been able to successfully pull from a given source, and which specific commit was last detected. It shows you key information like the Interval—namely, how frequently Flux will check for updates in a given source location.
You can also see whether or not that source is verified (if this is something that you have set up for the specific source).
Actions you can take:
- Apply filtering as you did the Applications view.
- Click a
URLto navigate to a given source—i.e. a repository in GitHub—or theNameof aSourceto view more details about it.
Go back to the Details tab, and click GitRepository/flux-system from the summary at the top of the page.
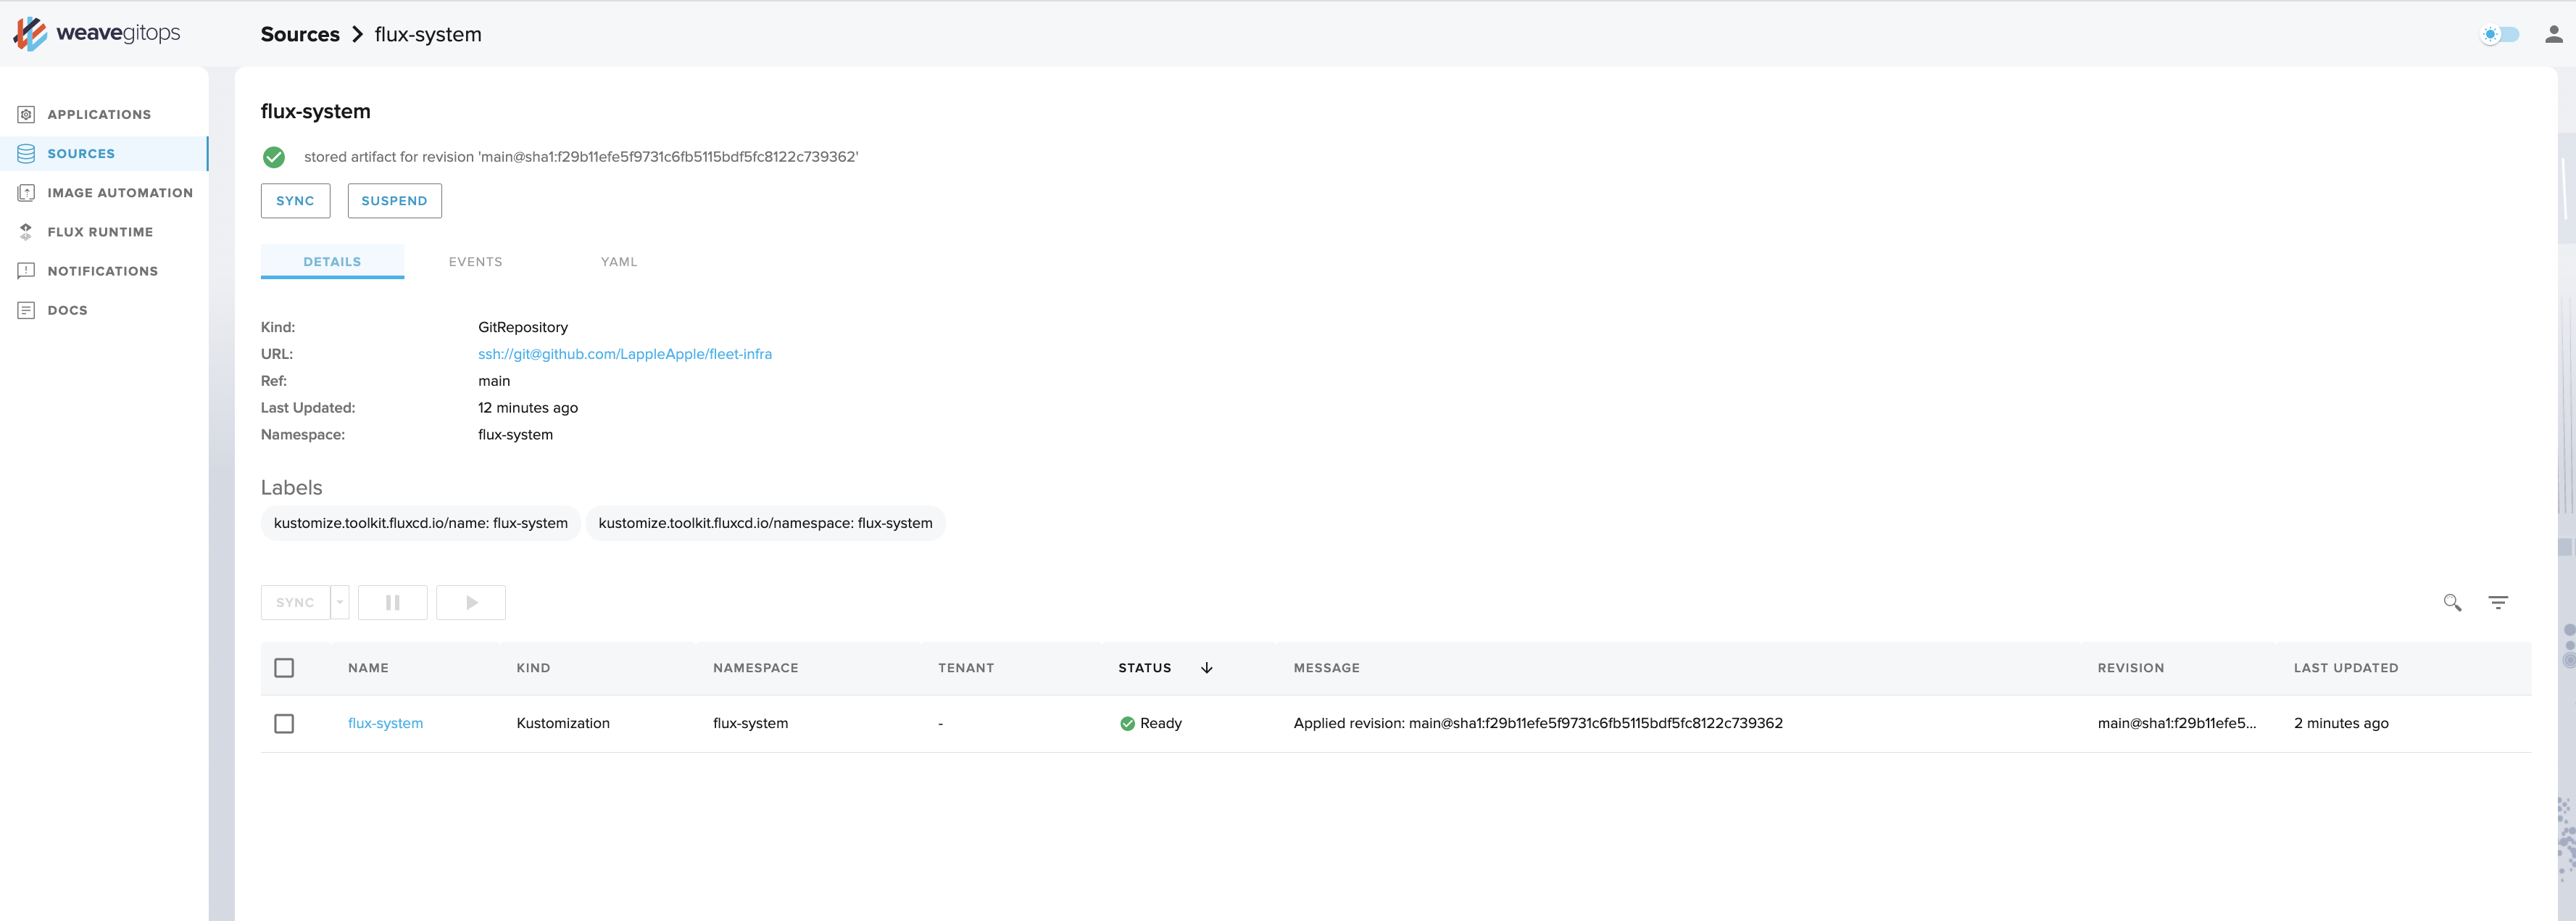
As with an Application detail view, you can see key information about how the resource is defined.
The Image Automation View
Maybe you're an app developer who wants to deploy the latest image in a dev/staging environment with as minimal fuss as possible and reduce GitOps friction. Or you might be a platform engineer who wants to keep your platform up-to-date with the latest approved versions—for example, patch releases to reduce exposure to CVEs—or auto-deploy when approval is gated before adding an image to an internal registry. The Image Automation view can help.
WeGO's Image Automation view allows users to configure automatic updates to their workloads based on the detection of a new image tag in a repository. For application developers, this means faster deployments and shorter feedback cycles to easily verify changes to an application in a Kubernetes environment. The view still supports GitOps workflows as the changes are committed back to Git—either to the branch already reconciled by Flux, or to an alternative branch so that a Pull Request can be generated and peer review can occur.
Image Automation refers to Flux's ability to update the image tag specified in a manifest based on detection of a newer image and automatically deploy to a cluster. It involves three required objects—ImageRepositories, ImagePolicies, and ImageUpdateAutomations—which WeGO OSS users can discover on their clusters. Users can also view object details either through a YAML-like view, as we do for most non-Flux objects, or a details view. The UI makes it possible to suspend or resume ImageRepositories and ImageUpdateAutomations so that Flux stops looking for new updates or committing these to Git. Also, the UI shows whether all required resources are configured and assists with Image Policy to show the latest image.
ImageRepositories, ImagePolicies, and ImageUpdateAutomations are used by Flux's Image Automation Controllers. The Image Reflector controller and the Image Automation controller work together to update a Git repository when new container images are available. In WeGO OSS, if the image-reflector-controller and or image-automation-controller are not installed on a cluster, a warning message will display.
If you make a mistake configuring one of the resources, you can use WeGO to easily trace from the Image Repository scan, see whether it is able to select the image based on the Image Policy, and detect whether an Image Update has successfully run. This provides greater visibility into the machinery provided by Flux and enables quicker troubleshooting than what's possible by hunting via the Flux CLI. App devs can triage issues without depending on their platform teams.
The Flux Runtime View
Let's go back to the left-hand menu of the UI and click on Flux Runtime. This view provides information on the GitOps engine, which continuously reconciles your desired and live state, and helps users to know which apiVersion to use in manifests. It comes with two tabs: one for controllers, and other for custom resource definitions (CRDs).
Controllers
The Controllers tab shows your installed GitOps Toolkit Controllers and their version.
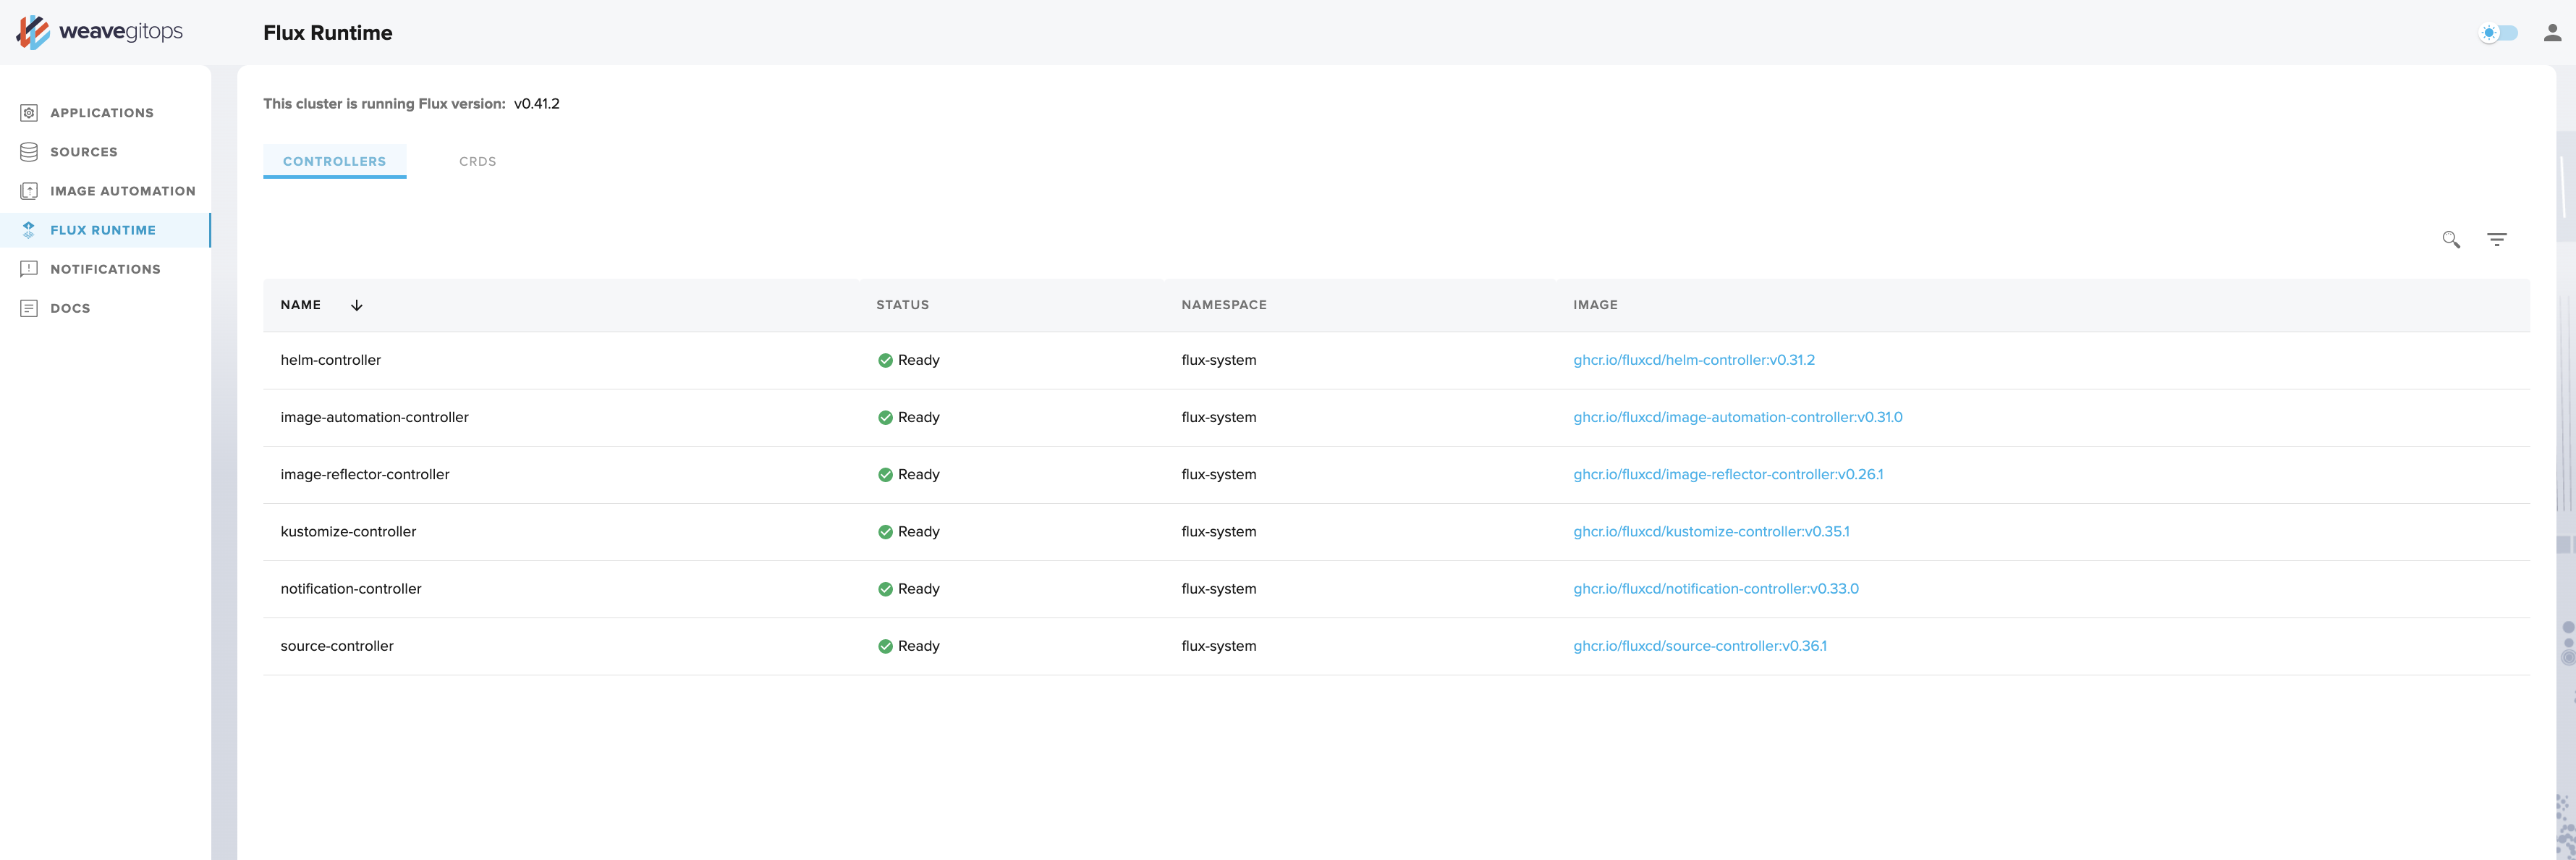
By default, flux bootstrap will install the following controllers:
- helm-controller
- kustomize-controller
- notification-controller
- source-controller
From this view you can see whether the controllers are healthy and which version of a given component is currently deployed.
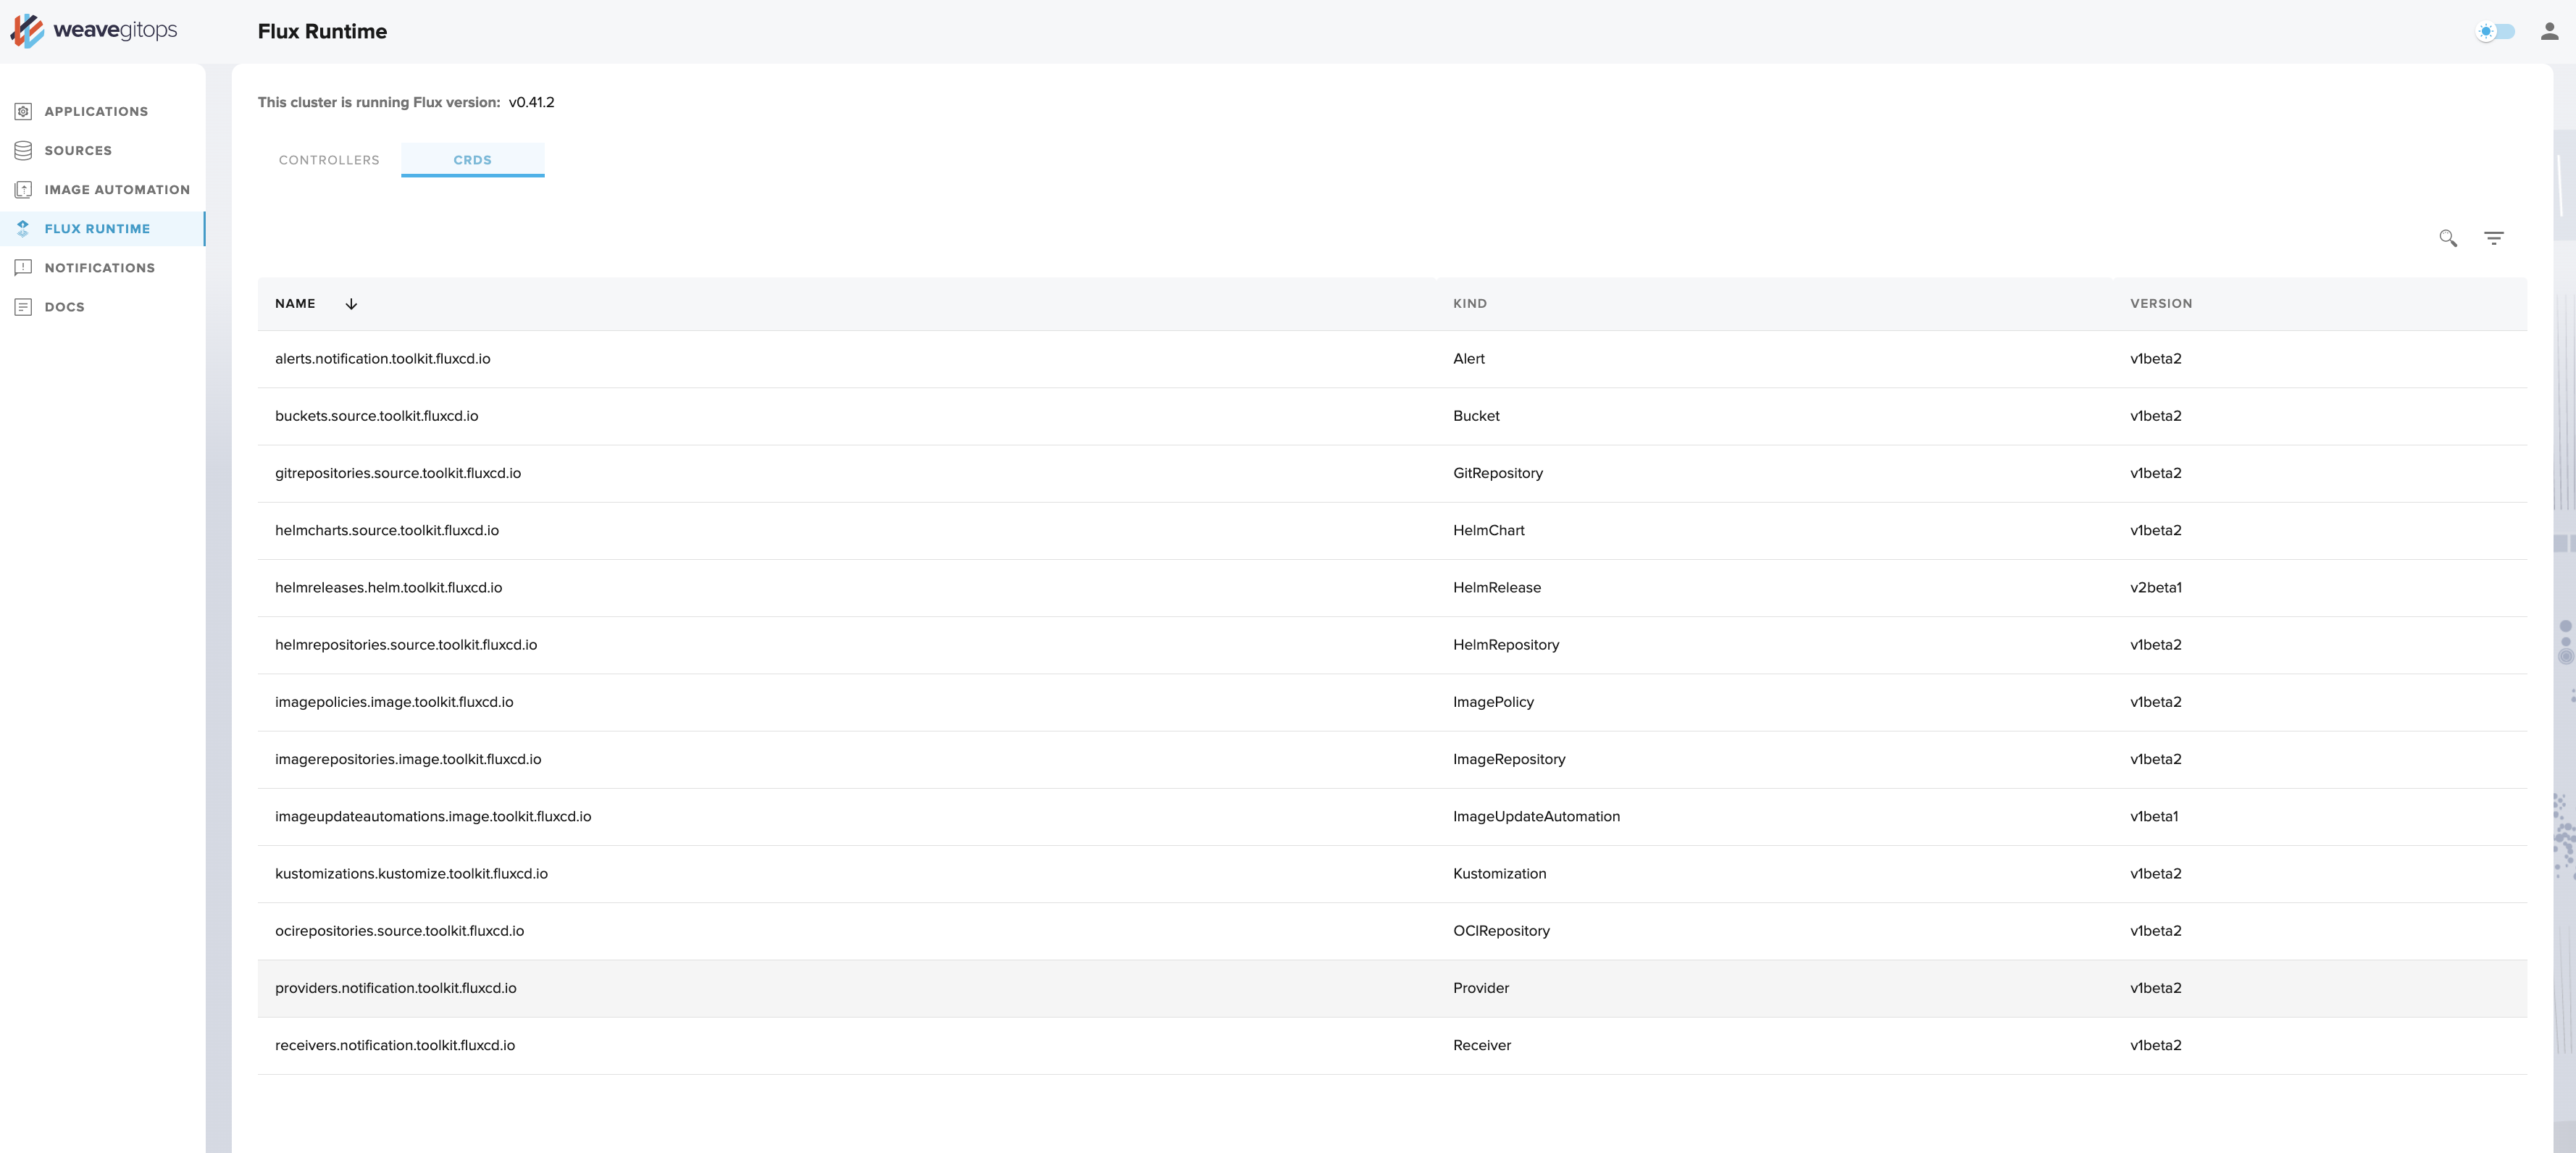
CRDs
The CRD tab lists the custom resources that the GitOps Toolkit Controllers use. This allows you to see which resources you will be able to create.
Moving On
Now that we are familiar with the dashboard, let's deploy a new application ✨.